Attempting to emulate some parts of the classic Windows 98 UI style in Yucan and also messing around with cursed mode.
ChristianB
Member since
Apr 17, 2023
Recent Activity
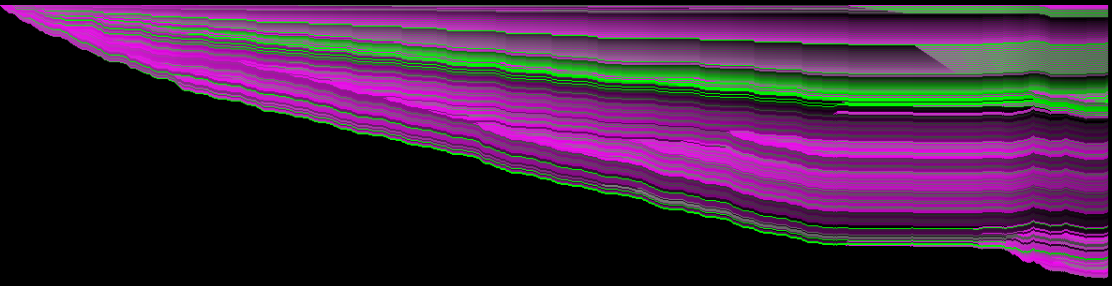
Yesterday's visibility jam experimentation. Visualizing memory/cache line access using dynamic binary instrumentation.
Just to explain: Each Pixel in Y axis is 64 bytes of memory (one cache line) and the X axis is one load instruction (only consecutive loads to the same cache line are batched).
The color goes from pink (no bytes accessed) to green (>= 64 bytes accessed) and fades out if not accessed over time.
The Y axis is in address order, so per column, one freshly accessed cache line can be inserted, which shifts the lower addresses down by one pixel. At most one unused (faded out) cache line is also removed per column.
Now I want to modify Spall to get this to show up next to a call trace.
Text layout and editing using ICU (script detection, BiDi, grapheme/word/sentence separation), Harfbuzz (shaping) and Freetype. All rendered on GPU using a dynamic glyph atlas and a LRU cache. Supports selecting fonts based on script as well as shaper-driven font fallback (similar to what Chrome does). No subpixel positioning yet, but it shouldn't be too hard to add. My goal is get as close as possible to what modern browsers can do with text and I think this is getting there.
Also the second video shows the first 131k (0x1ffff) unicode characters covered by all the Noto fonts.