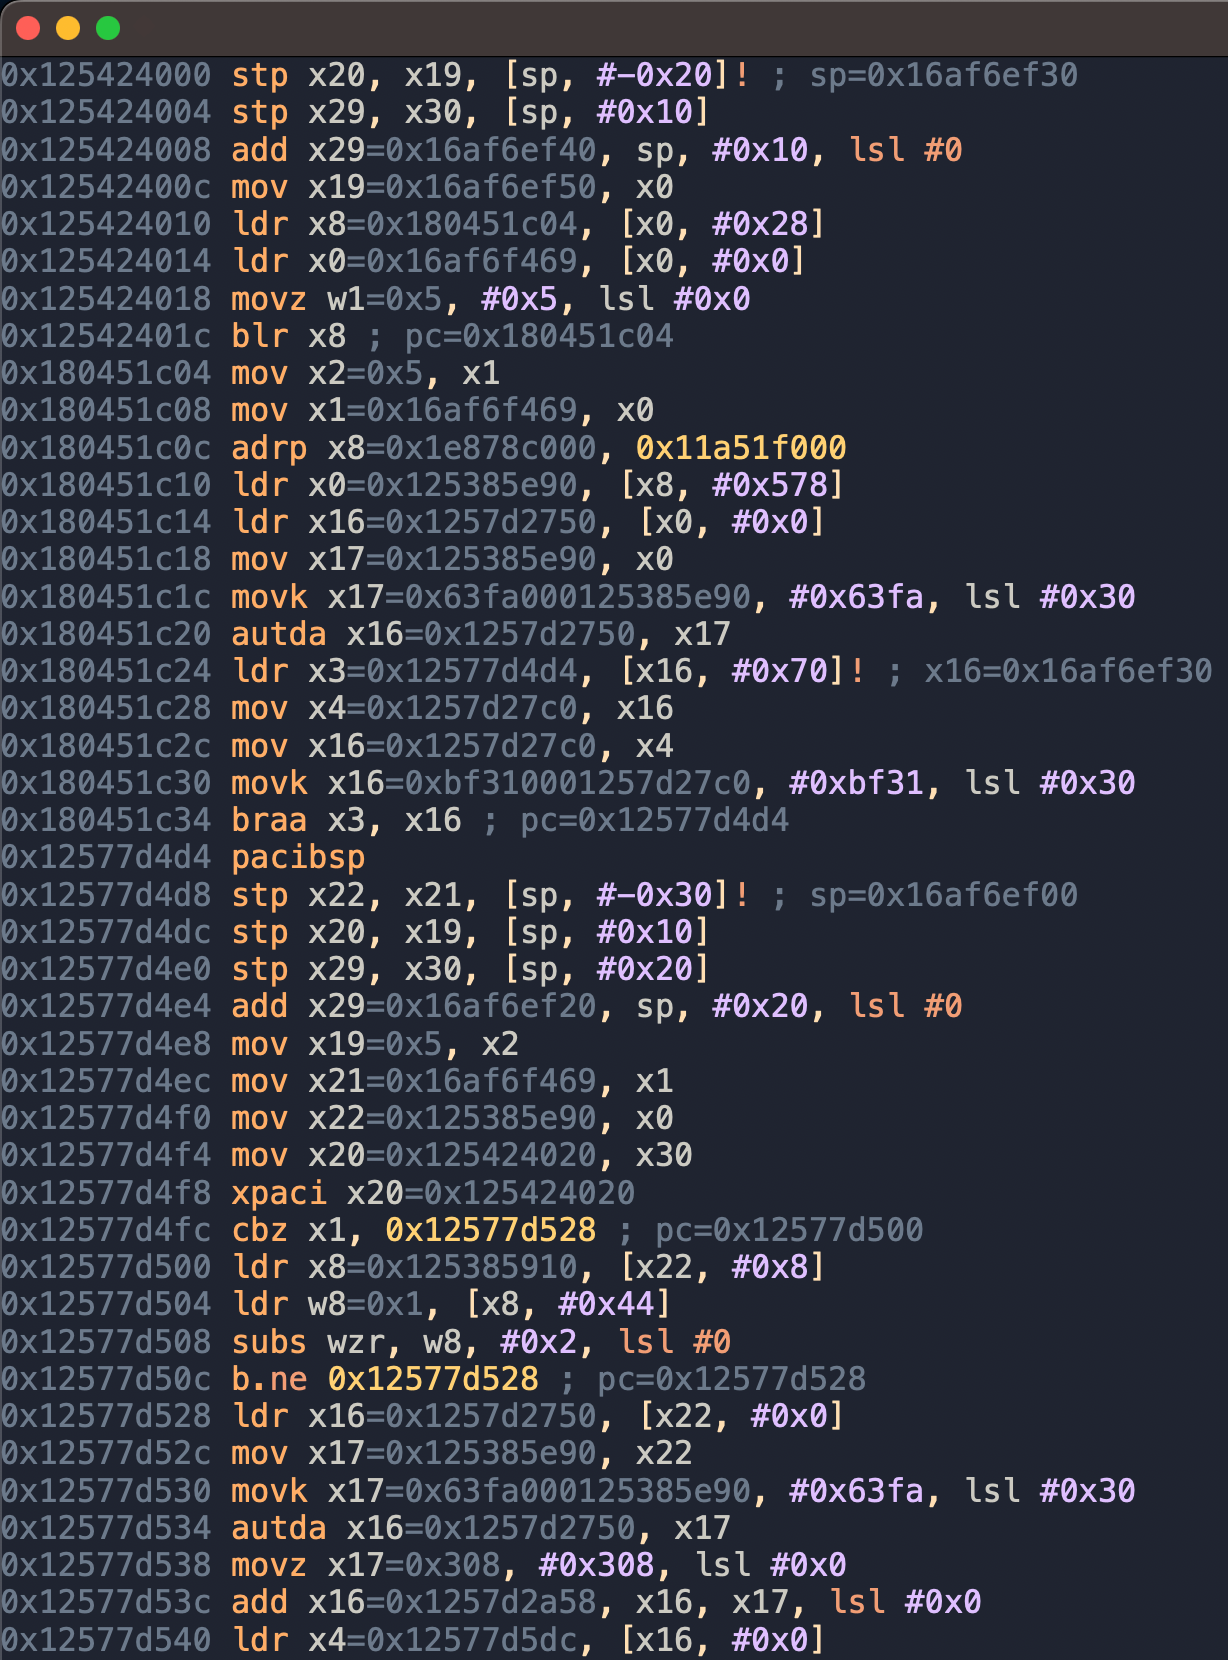
my goal for the 2025 wheel reinvention jam was to explore what the assembly level debugging interface for the time travel debugger i'm working on could look like. the base tech currently allows me to record the execution of a program and replay it at instruction granularity. that is, i can seek to a particular instruction that executed and then single step the program state from there. and in fact, that's exactly what i did on day one: i just started with the first instruction in the recording, rendered its disassembly and the values of register writes, advanced the state to the next instruction, and so on:
so far, not particularly insightful. of course, rendering symbol names instead of raw addresses would already have helped a lot, but i was interested in solving bigger issues.
if you've done assembly level debugging with regular step debuggers before, the above interface probably seems very strange to you. drawing the instructions in the order in which they executed¹ discards a lot of structure you'd otherwise get for free. usually, in a step debugger, you'd see the assembly as it exists in the program's binary. so you'd be looking at one function at a time, and, with experience, you'd be able to recognize patterns in the static layout of the code (eg: loops or bounds checks). in my visualization, we've lost both of those benefits. function calls are effectively "inlined", and control flow is flattened, so you can no longer get a sense of the overall structure of a function.
this is probably a good point to mention why i'm going with this "execution order" approach in the first place instead of doing the usual static thing. the idea is that we're "mapping time to space": the y-axis represents the logical time in the program. this allows us to visualize states at different times in the program without having to manually step forward and backward. a very basic and not particularly useful example of this is the register writes in the above screenshot. they allow us to see all values the registers ever had at once. for a more practical example, we could imagine drawing a visualization of some data structure (like a linked list) to the right of the code whenever the structure changes.
but i'm getting ahead of myself. we first have to solve the code structure issue. the first step i took in the jam was to make function calls expandable and folded by default:
(i can't seem to be able to embed a video here, you can check out the clip i posted during the jam instead)
now we're starting to see something! there are some symbol names, and the "tick numbers" on the folded calls even give us a sense of where the program spent most of its time. (disclaimer: ticks are the number of instructions executed, so they are only a crude approximation of runtime performance.) i posted this demo video near the end of day three. things were going well! unfortunately, that was about to change as i shifted my focus to the control flow issue.
the big idea:
while the foldable function calls made it easier to reason about the relationship between calls, it was still very difficult to understand what was going on inside a call. so my idea was: what if i could find the conditionals and loops inside of each function and then draw those for each call of that function?
basically, imagine some C code, but replace all the statements with assembly code, keeping only the control flow constructs (and move the boolean conditions above the if
s and while
s). loops could still show all of their iterations back to back, sticking with the y=time idea, or they could show a subset of iterations, or they could be paginated. and the side of an if
that didn't execute could be folded away. that way, each call would look the same structurally, and you wouldn't even need to learn to recognize control flow patterns, the debugger could just do it for you.
so this was my master plan. sadly, i got stuck on step one for the rest of the jam: identifying control flow constructs. being real, i thought this was gonna be super easy, maybe a day or two of work. unfortunately, i had no idea what i was doing and went with a high risk, low reward strategy that, in the end, led me (almost) nowhere.
analyzing control flow:
i came across this idea of a single-entry/single-exit (SESE) region, which is exactly what it sounds like. it's a set of basic blocks in the control flow graph of a function that only has one incoming edge from outside the set and one outgoing edge leaving the set. this sounded very useful, as standard structured programming constructs like if
and while
follow exactly that pattern - or so i thought.
after finally getting an implementation working in about three days, i noticed a problem: the vast majority of functions in the code i was analyzing (liblua) had almost no SESE regions. and most of the SESE regions that did exist were loops. but i could already detect loops with tarjan's algorithm.
if structured control flow constructs were SESE regions, why weren't there more of them? i was looking at compiled C code that wasn't exactly littered with goto
s after all. well, of course, the assumption was incorrect.
ignoring the more obvious culprits like return
and labeled break
s, it turns out, ifs
aren't actually single-entry/single-exit. you can exit the if
in two ways: through the then branch or through the else
branch. yes, they do converge after that, but that's already in the next control flow construct:
(please excuse my graphviz)
conclusion:
while i didn't manage to finish my jam project before the deadline, i did learn a lot about control flow analysis. and even the lengthy implementation of the SESE algorithm that i ended up throwing away in its entirety turned out to be very useful actually, as it exposed some issues with my existing basic block and control flow graph data structures that i would not have run into with a shorter implementation.
¹ "executed" meaning "executed architecturally", or "retired". this does not reflect the "actual execution order" on an out-of-order core.