fixed a bunch of bugs in my aarch64 -> aarch64 jit this past week.
i can now run several complex programs without crashing, including Preview.app (showcased in the video). performance definitely needs some work in the long run, but for now, it's good enough :happy_triangle:

leddoo
Member since
Sep 22, 2021
Projects
Blindspot Debugger
Time Travel for Native Code
A
asm trace
reinventing assembly level debugging
D
dataflow debugger
exploring algorithm visualization
M
memory hexplorer
Explore your program's memory like you explore code with an IDE.
K
kibi proof assistant
an interactive proof assistant
Recent Activity
Blog comment:
How to Record & Replay Native Programs
leddoo
—
Blog comment:
How to Record & Replay Native Programs
leddoo
—

new blog post about internals and challenges faced by my time travel debugger &blindspot with some comparisons to rr and WinDbg
https://handmade.network/p/675/blindspot-debugger/blog/p/9099-how_to_record__replay_native_programs
Project blog post:
How to Record & Replay Native Programs
leddoo
—
Blog comment:
Generating 30 kloc of Asm for Fun and Profit
leddoo
—
Blog comment:
The first 1.5 Years
leddoo
—
Blog comment:
The first 1.5 Years
leddoo
—

i rewrote my aarch64 interpreter in raw assembly to reduce my compile times by 80%.
and i fuzz tested it!
Project blog post:
Generating 30 kloc of Asm for Fun and Profit
leddoo
—

Project blog post:
The first 1.5 Years
leddoo
—
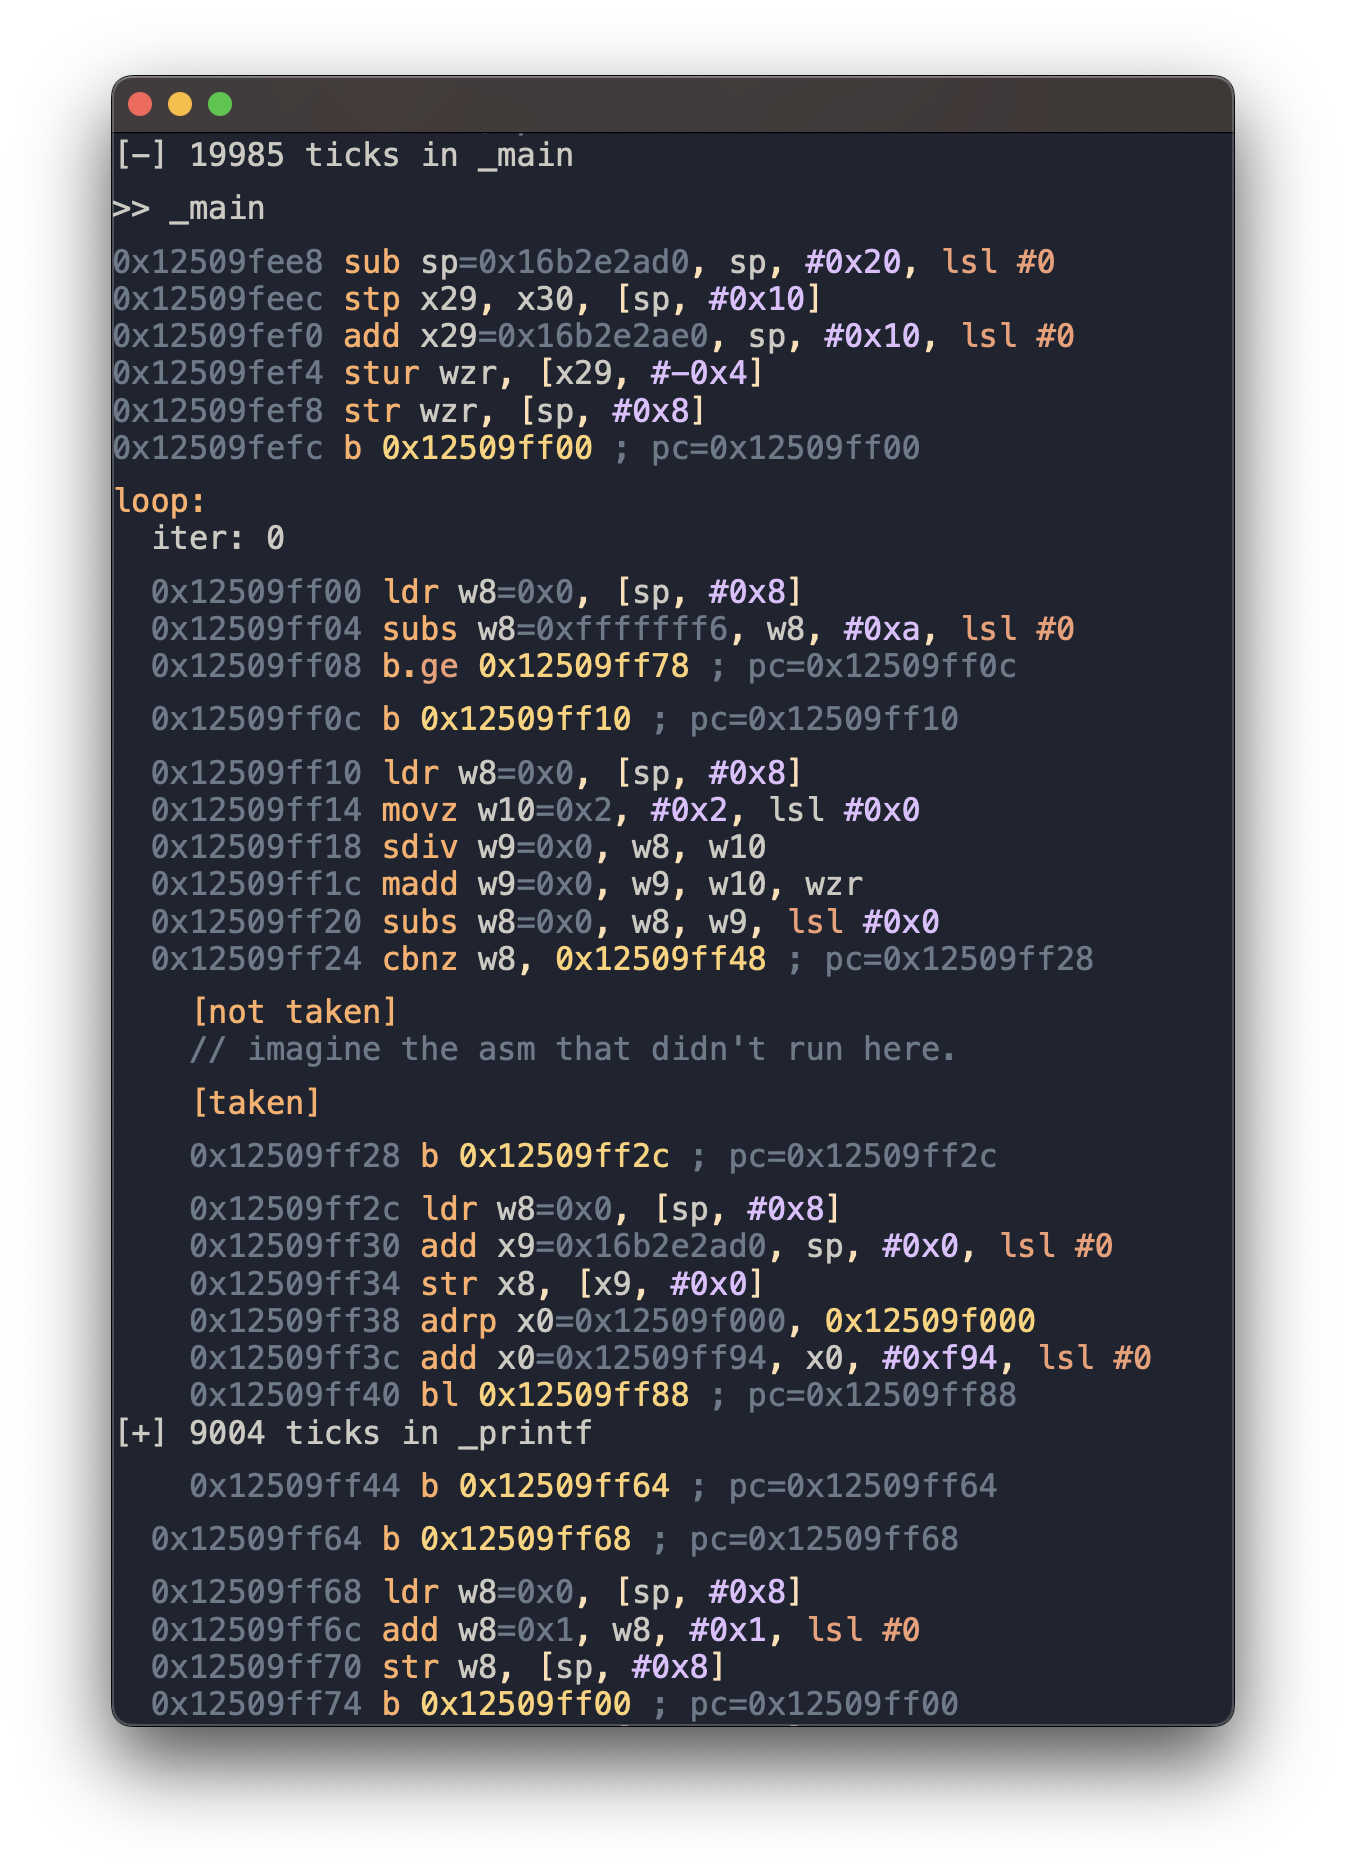
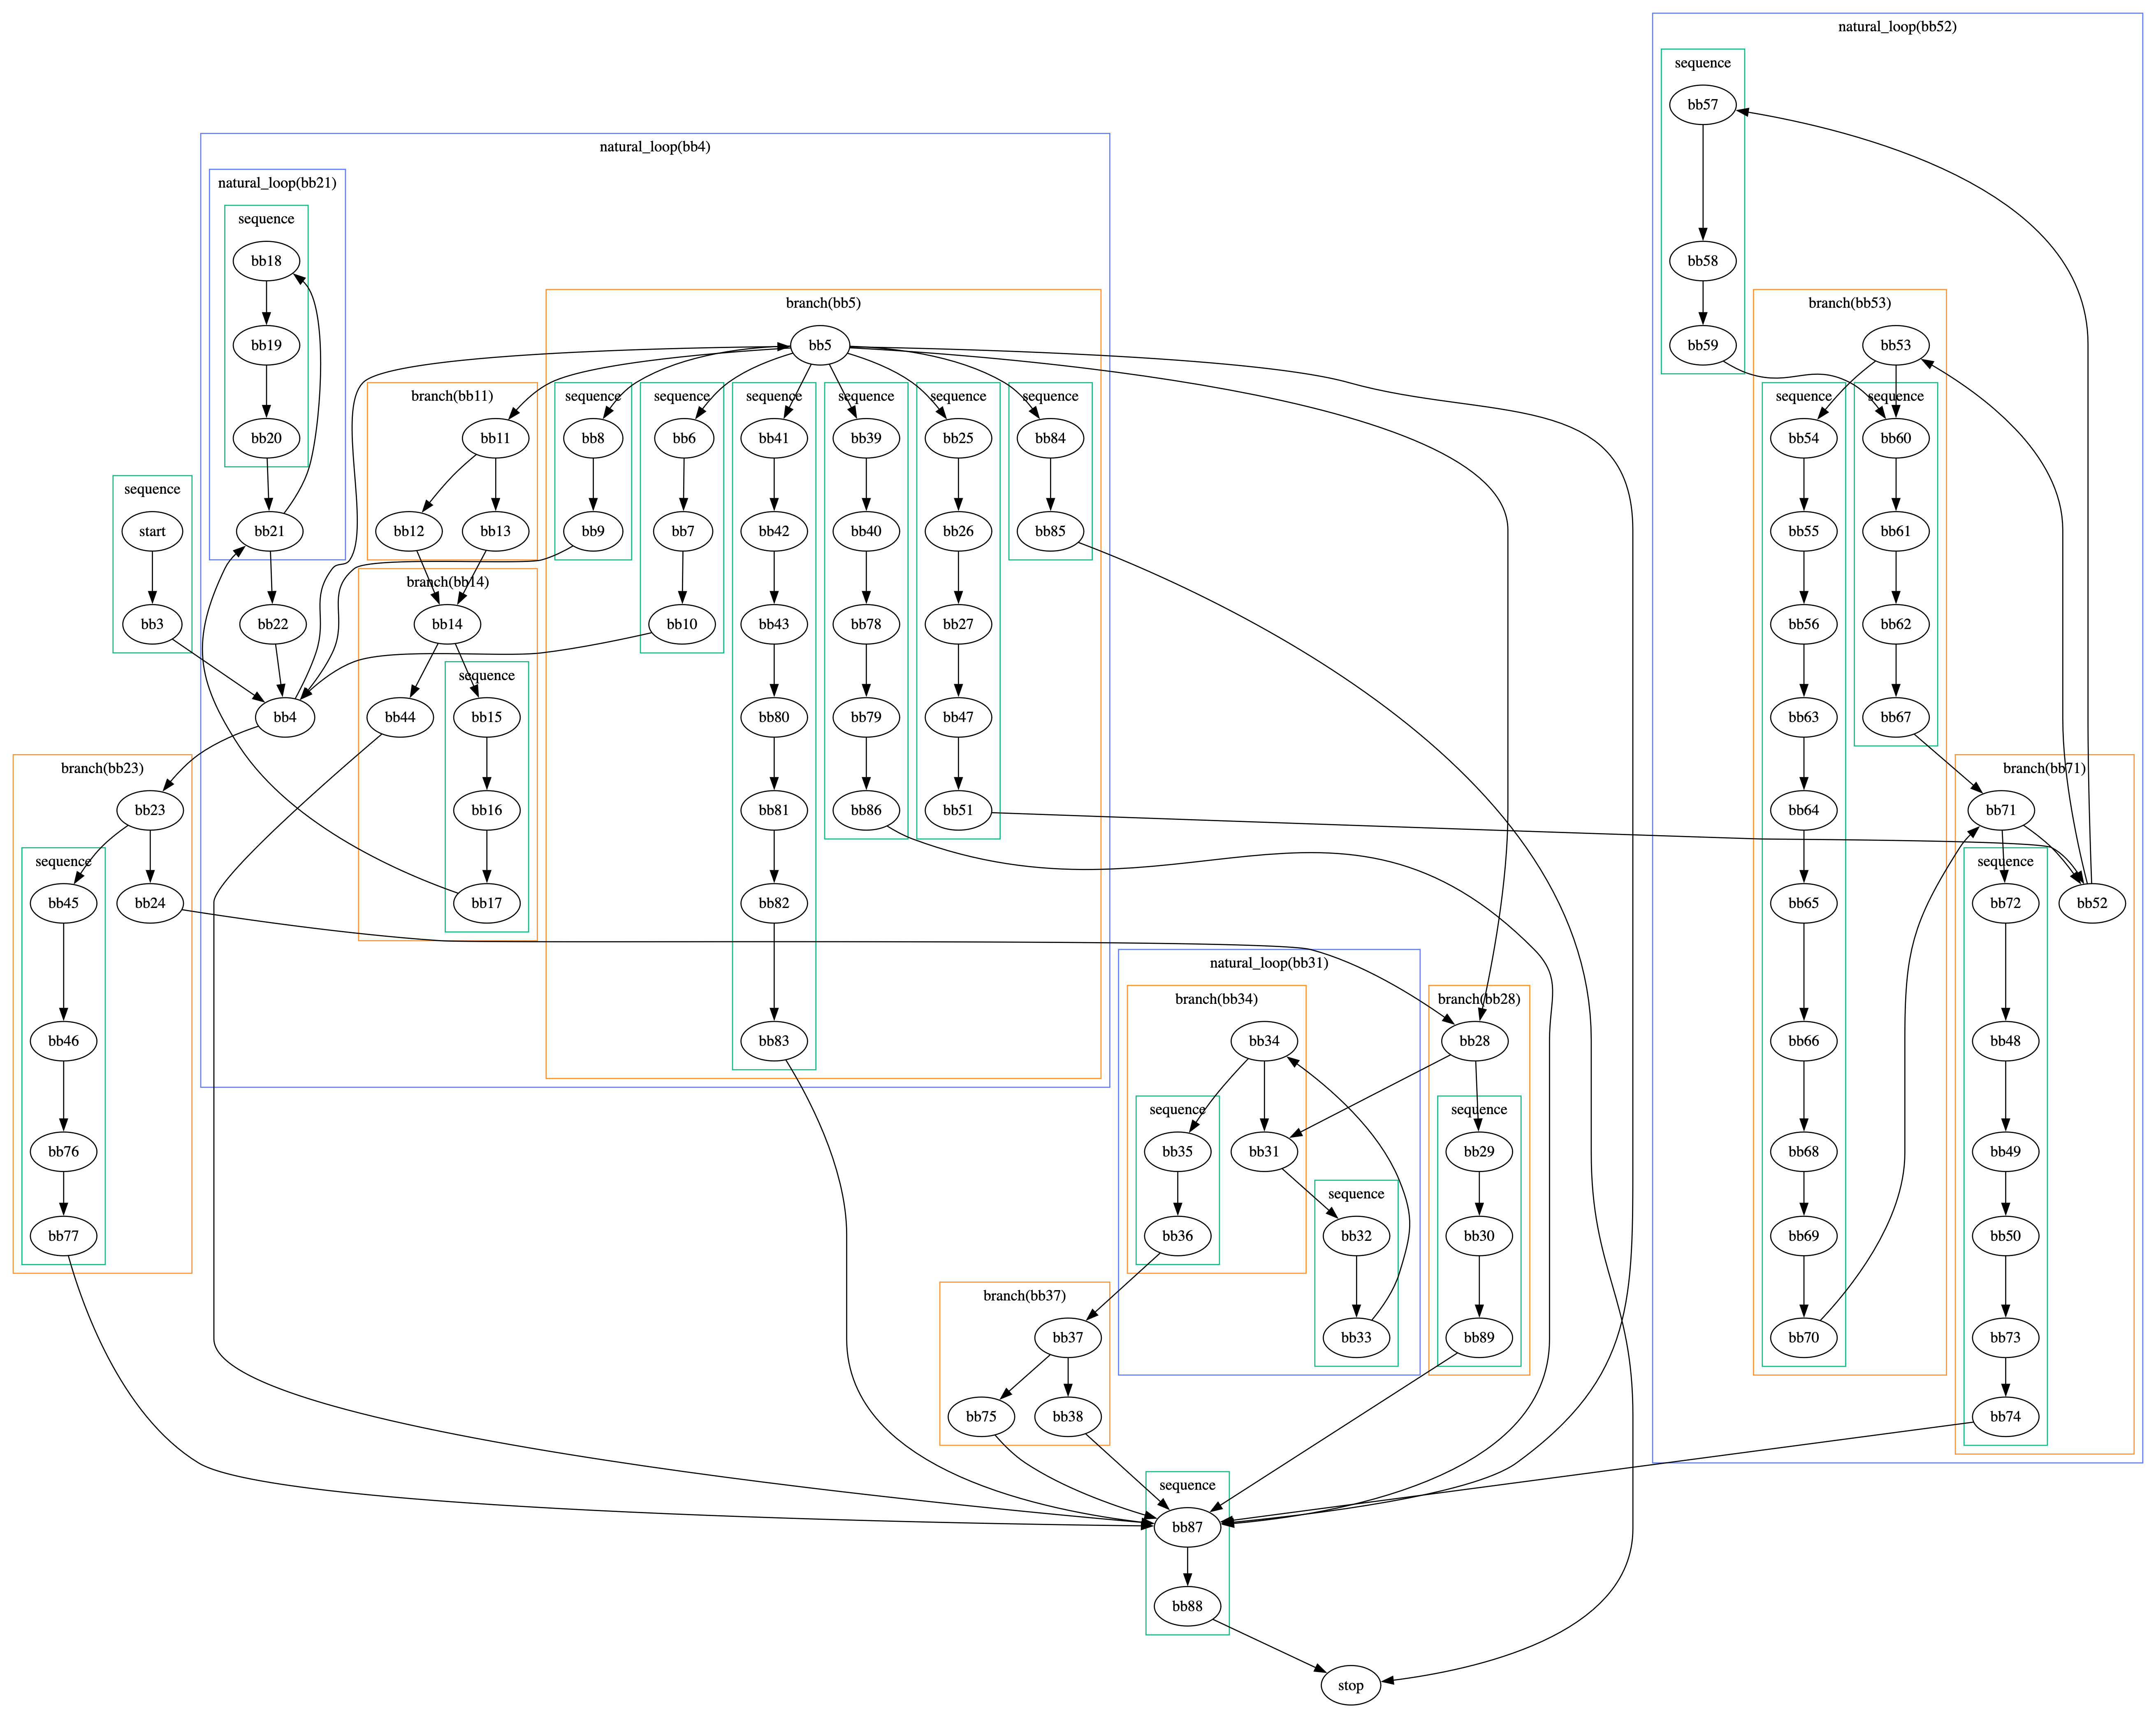
[post-jam]: here's a rough demo of rendering the control flow constructs in the executed assembly code. it's very broken and very complicated right now, but it's good enough for a demo screenshot and for me to finally call the jam project done :P &asm-trace
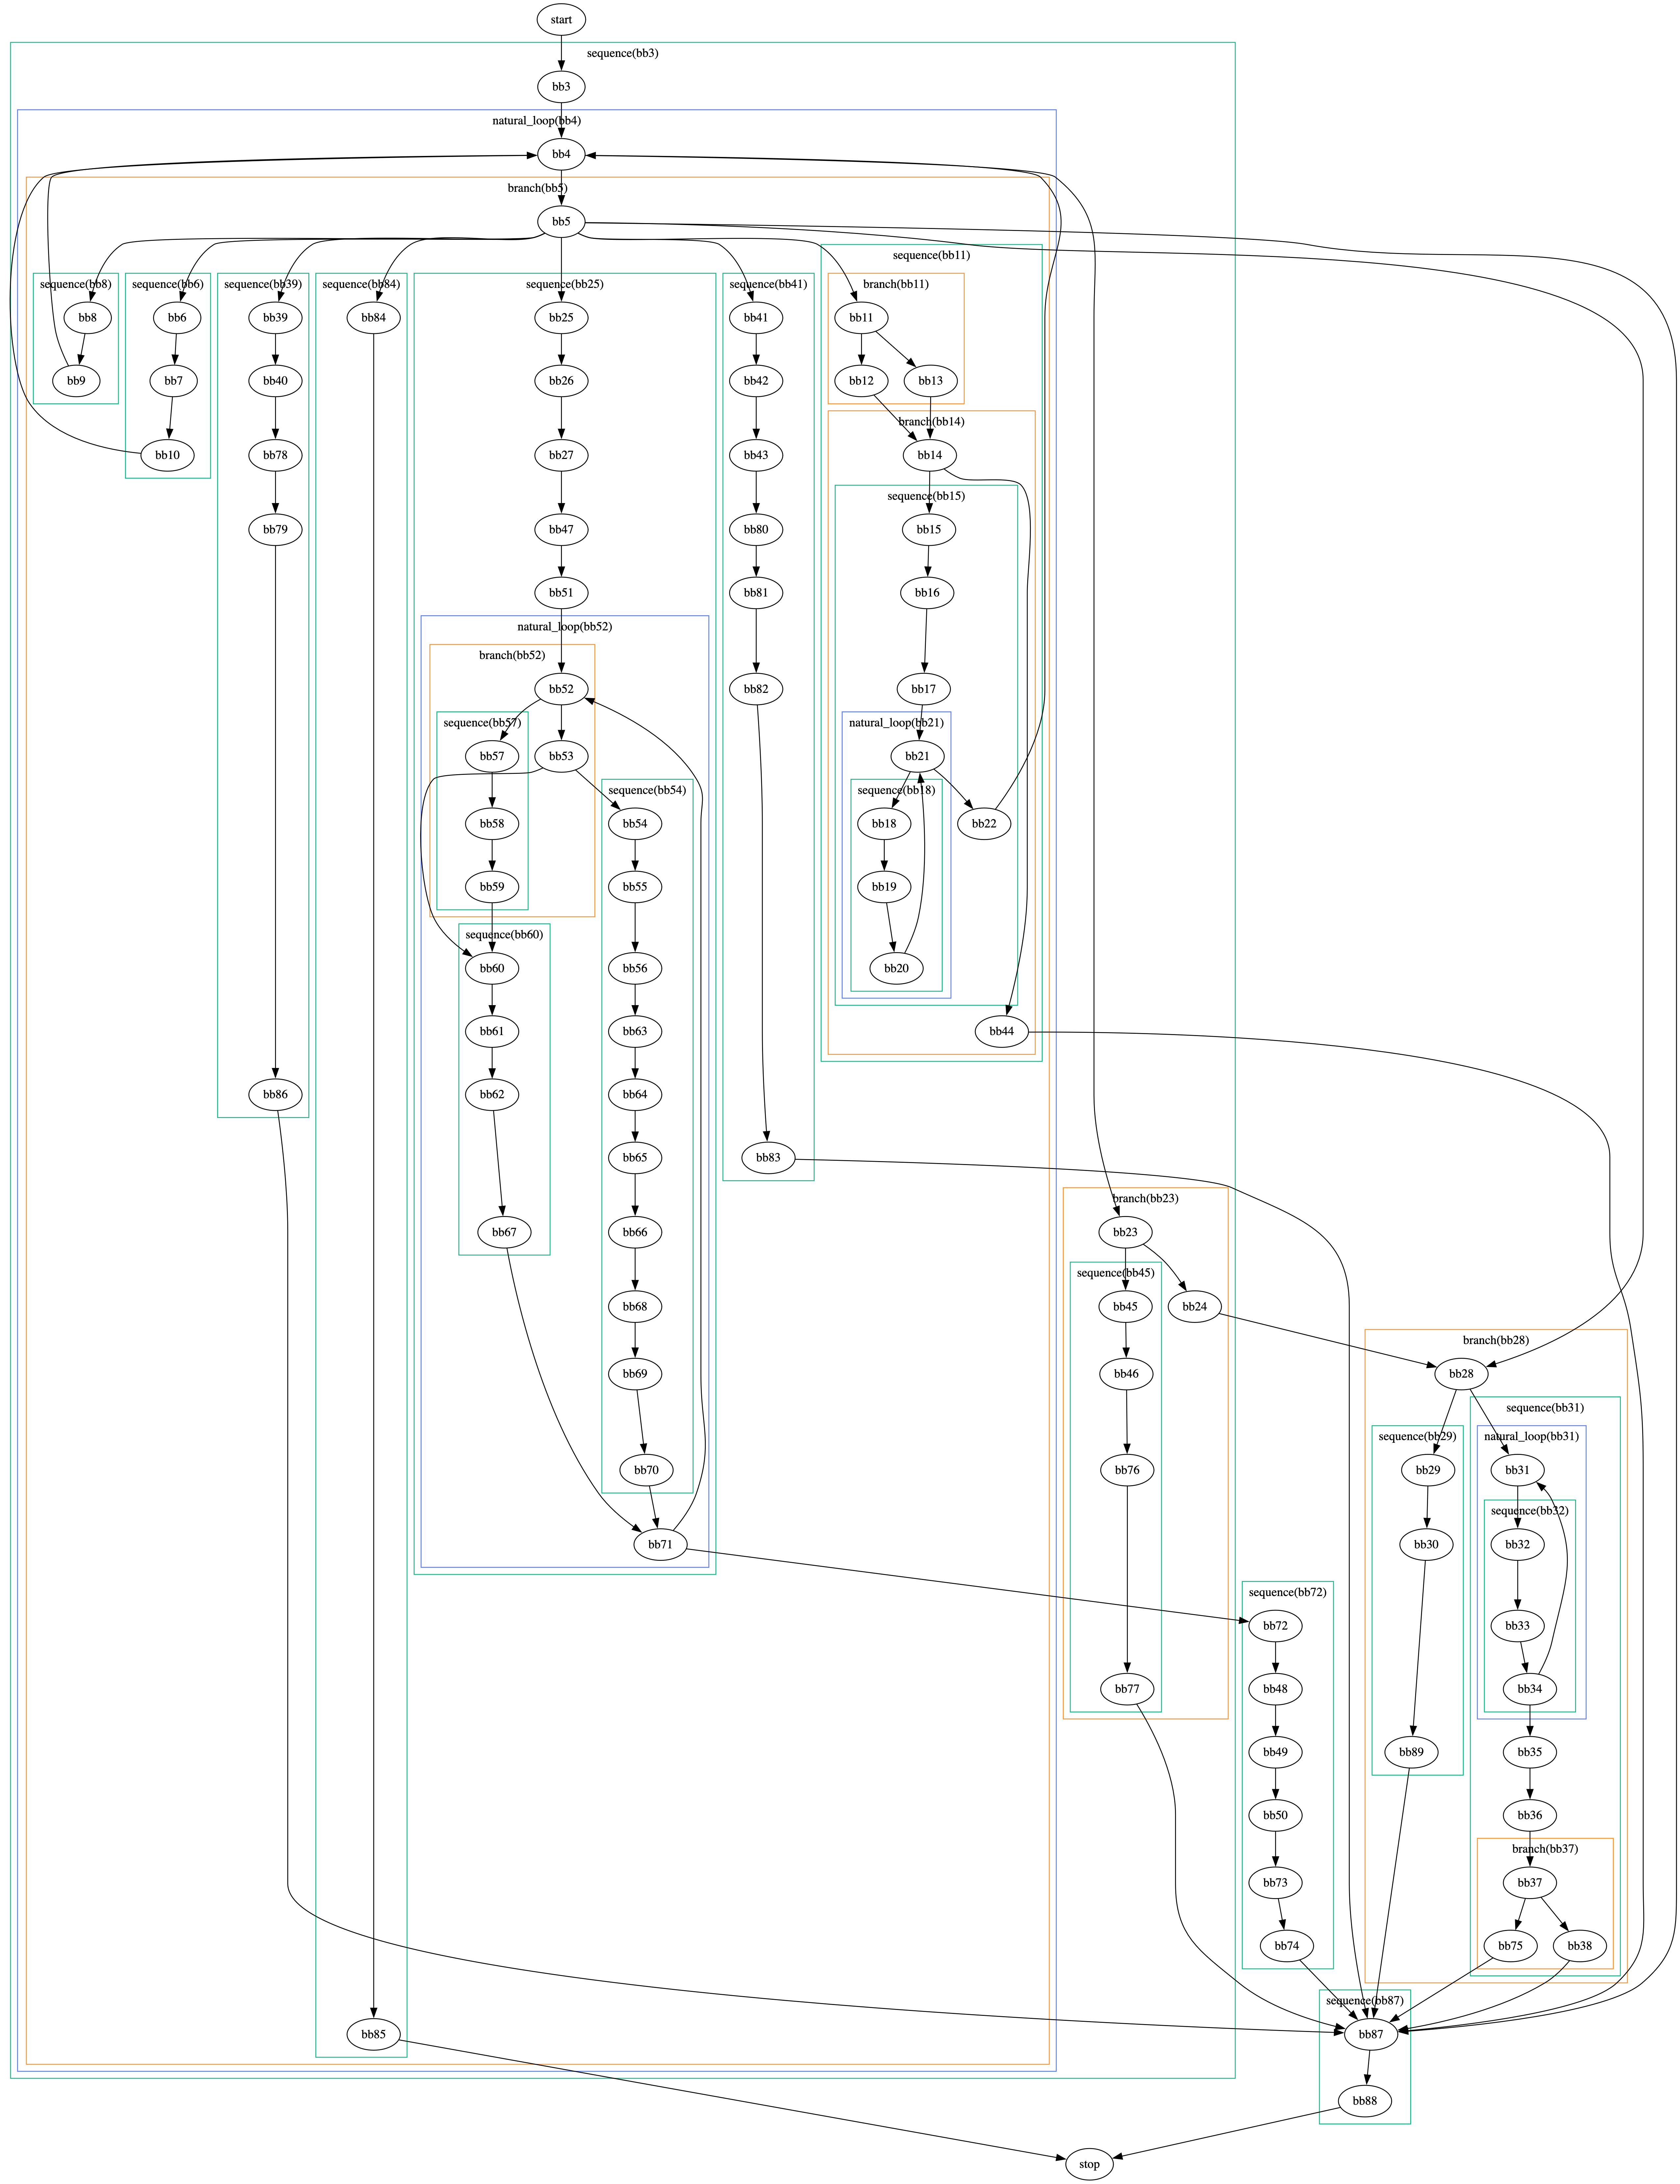
[post-jam]: rewrote the control flow analyzer. each structure now has a unique header (a basic block) that dominates everything inside the structure, which turned out to be a useful invariant. &asm-trace
Project blog post:
asm-trace jam recap
leddoo
—
days 4-6.83: identifying control flow constructs was way, way, way harder than expected. i'm finally getting somewhere with the analysis. but i'm not even close to using this data to improve the &asm-trace interface.
day 1: drawing the instruction stream with the written register values. the rest of my time today was spent coming up with ideas for making it more understandable and figuring out which ones would fit in the time frame of the jam. i'd really like to infer types (incl structs), but that seems like a massive rabbit hole. so for now, i'm gonna focus on "adding function calls". &asm-trace
project wrap up:
if the screen captures i posted here didn't make much sense to you, believe it or not, that was actually the whole point of my project. and by that i mean that the goal was to build something tailor made for me to better understand an algorithm i'm working on. and without knowledge of that algorithm, the data just doesn't make a whole lot of sense.
i wanted to figure out what it would take to create a custom visualization and how that process could be streamlined. because i think custom algorithm visualizations are a huge thing we're missing out on, not only for debugging, but also for internal developer documentation. some things are just much easier to understand with an interactive visual.
but while it's certainly nice to have visualizations, there's a question of whether they make "economic sense" to create. for example, if you spend 6 hours to build a visualization, which then allows you to fix a bug in 1 hour, and without the visualization it would have taken you 5 hours to fix the issue, then you saved -2 hours. in other words, you lost time. though there is a potential argument to be made that the tool may pay more dividends in the future, when you or some other dev comes back to the algorithm. then again, since the tool is tied closely to the implementation, there are also additional future costs for maintenance to be considered.
in practice, it took me around 10 hours to build the tool (excluding project setup time), and i spent around 7.5 hours using the tool to debug issues. if we exclude potential future time savings or costs (and points for "i just like doing this sort of thing"), then the tool would have had to save me at least 10 hours of debugging time. while it did certainly accelerate debugging significantly, i think that the savings are well below 10 hours, maybe around 2-3 hours. if we then also factor project setup time back in, i think we may have some anecdotal evidence for why "building custom visualizations" is just not a thing we do, unless we really need it.
my goal is now to bring down the time it takes to create such visualizations to under 2 hours and ideally closer to 30 minutes.
day 5: added interactive navigation.
been using the tool (alongside graphviz) and have identified and fixed 5 bugs so far that would have been pretty hard to diagnose otherwise. &dataflowdebugger
day 4: now showing the diff between outputs when processing the work list forwards vs backwards. if my implementation was correct, this view would be empty. but then i also wouldn't need a dataflow debugger 🌚
added tabs to explore the history of dataflow nodes in each of the logs. &dataflowdebugger

success: i just found the first bug in the dataflow analysis :weewah:
in this step, r3 becomes ? in vals_out, but for some reason it remains unmodified in restored_vals_out.
right now, i'm just manually changing which log file to view and which dataflow node to display in the lua script. would be nice if i didn't have to restart the program all the time, but it's already kinda usable, so that's nice. &dataflowdebugger

day 2:
created a structured log of "things happening in the dataflow analysis".
then experimented with a generic viewer for that log, where specific log messages could be replaced with a custom ui builder.
ended up not really liking that. so tomorrow, i'll pre-process the log to build a more useful data structure. and then just build custom uis for different debugging use cases. &dataflowdebugger

day 1: just some project setup.
plan is to do some structured logging, then figure out how to visualize that in a way that's useful.
decided to use lua both for the log format and the ui implementation, hoping that that will give me a fast iteration cycle.
didn't have much time today, and most of that went into creating lua bindings for my ui library.
funnily enough, that doesn’t actually work :P
cause by wrapping your data in Cell<&’a T>, you’re kinda doing the same thing as putting it behind a &mut.
and finally, interactivity &hexplorer
the new jump list allows you to quickly find global variables, stack frames, or instances of a given type.
you can now follow pointers by clicking their values.
and, among other things, the new inspector shows you the incoming and outgoing pointers for the selected object.
drawing the memory map from yesterday! &hexplorer
as i scroll through memory, we first see some global variables (including the malloc state).
those are followed by the stack (the cyan/green/brown bands are stack frames; the stack is quite a bit larger, i'm current not drawing zero bytes).
and at the end, there's the heap. where we can see a linked List (created by the demo program).

mapped out memory using debug info. &hexplorer
i spent quite a while figuring out how to deal with aliasing.
turns out, my test program (almost) doesn't have any aliasing 😄
edit: yeah, no, of course it does. silly little bug.
for anyone interested, i build the mapping in two passes.
first, i collect all unique (ptr, type) pairs by following pointers depth first. (this uses a visited set, which caught the aliasing)
then i sort those by decreasing type size and create the mapping.
sorting makes sure i create mappings for structs before processing pointers to their fields (roughly). which is useful for storing "reverse pointers".
got a basic "info panel" working. it shows the local assumptions and the current goal (at the cursor).
as in my previous demo, the first example shows using the rw tactic to use theorems to rewrite the goal into the form x = x, which is trivally true.
the second example shows unfolding definitions (negation is defined as P -> False) and introducing assumptions.
sadly, i only had two days to work on the project this week (so i didn't really get to the "interactivity" i had hoped for). still it was a lot of fun and i learned a couple of things 👌 &kibi-pa
got some basic proof tactics with manual proof goal inspection working. &kibi-pa
some experimental source code / bytecode mapping visualizations.
the idea is to show which source level values are stored in which registers at each point in the program.
i wish it wasn't as confusing 😄
it could help to highlight one source value as the primary one. and maybe make showing aliases optional.

i made a "little" video about switching to an ssa based compiler.
(though most of the vid is not actually about ssa form)
thanks again @ratchetfreak and @negate32 for all your help!
https://youtu.be/kESmRMDHZZk
oh, btw, useful resources for implementing ssa form in the description!


making some educational videos about vector graphics.
hoping to eventually cover how my renderer works.
https://youtu.be/33KqDTwdR08

[vector renderer]
implemented basic stroking (butt caps and bevel joins).
performance dropped quite a bit, because the renderer is currently memory bound. (frame buffer doesn't fit into the cache. i'll implement tiling next to fix that.)

working on a vector renderer once again. performance is pretty good 🙂 rendered on one cpu core without any caching. but haven't implemented stroking yet.
here are some more examples in a hypothetical functional language:
- the last bit is arguably unreadable. you could try to "refactor" that, but i think different code representations are necessary to make this kind of computation understandable. the simplest of which is to visualize the computation in a parallel view for a given example.
- here,
eachis actually a function (map). the language pretty much only has functions andletbindings. - uniform abstract syntax is nice for language extension and other kinds of meta programming.
- the key idea here is to have a surface syntax on top of the AST to make things prettier.
recently discovered an interesting lispy, operator, whitespace syntax:
- it is designed as syntactic sugar on top of a simple, meta programming friendly ast.
- precedence isn't 100% worked out.
(mistake in separator example: should of course parse as
... [make-random-list 5] ...)
New forum thread:
note app - "submission"
leddoo
—
Forum reply:
REGISTER HERE: Jam projects / teams!
leddoo
—
Forum reply:
[jam] Math thingy
leddoo
—
Forum reply:
REGISTER HERE: Jam projects / teams!
leddoo
—
Forum reply:
REGISTER HERE: Jam projects / teams!
leddoo
—
Forum reply:
REGISTER HERE: Jam projects / teams!
leddoo
—
The dependency system now supports nested content sized elements, which is pretty noice 👌
I have also been working on an imgui library. It's still super early days and many things will change (like passing a string to a label), but the basic idea is there!