this article is about the first 1.5 years of work on my time travel debugger.
introduction:
the story begins on february 23rd 2023, when d7 posted a link to the tomorrow corp tech demo in the handmade network general channel. the video was truly a mind expanding experience. they showcased a tool that allowed you to scrub through recordings of someone playing their game as if it was a video. but these "recordings" didn't just contain screen captures, no, they contained "the entire execution of the game". you could select any point in time, and their tool would reconstruct the entire game state at that point, including the function callstack, local variables, and the partial draw state of the window. you could single step through the renderer code and see game objects appear on screen like in renderdoc.
and you could do something that was impossible in every other debugger that i had seen so far: you could step backwards. i was way too familiar with the experience of carefully getting my program into the right state in a debugger, only to forget what some value was a minute ago, or to step too far by accident and have to go through the entire procedure again. very frustrating!
but it gets worse: when your program crashes due to memory corruption or other state bugs, a regular debugger can easily show you the state of your program at the time of the crash. unfortunately, the actual cause of the crash - the corrupting write - could have happened a long time ago. but that's no problem in the tomorrow corp's debugger! whenever they had a crash on some bogus value, they could just tell their debugger to run the program backwards from the crash to the point in time where the corrupting write took place. i've had bugs in my code where this feature alone could have saved me several hours!
given how excited i was about this idea, you might assume that i started working on my own time travel debugger immediately. but for some reason i didn't. instead, i kept working on my programming language experiments for a while. by late 2023 though, i decided that i wanted to work on something "commercially viable". at first, i toyed with an idea for a web based data visualization tool, but my heart wasn't in it. i had started that project with the sole goal of making money, and it wasn't even particularly promising in that regard. so by march of 2024, that project had entered the graveyard as well.
but as i was looking around at the nearby tombstones, i had an idea: a few rows next to it lay a WebAssembly interpreter that i had built for an interactive programming environment type thing in summer of 2023. it was in part inspired by the tomorrow corp demo, but there was more to the idea that i don't really remember right now. i thought, hmm, what if i went all in on a time travel debugger for wasm? strip all those other things, just something to help people debug their code. why wasm, you may ask? great question! to understand that, let's talk about how time travel debugging actually works.
the fundamentals of time travel debugging
we'll define a time travel debugger as a tool that can reconstruct past program states. the easiest way to implement such a tool would be to simply record the relevant program states at runtime and dump them into a giant file. if you think i just described print debugging, then i would agree. and i would argue that print debugging is the most primitive form of time travel debugging there is.
but print debugging has its limitations. the biggest issue being that you have to modify the program and rerun it to capture additional information. if your program is nondeterministic - by design or by accident - this can be a giant pain. so... what if we just recorded everything? then we could easily use that data to generate any print log by selecting a subset of the recorded values. or we could build that "a step debugger that can go backwards" experience i described in the intro.
well, it turns out, "everything" is a lot of data. modern processors execute billions of instructions per second. so even if we only captured a single 64 bit register value for every instruction executed, we'd already generate more than 8 GB/s of data (and massively slow down the program in the process).
fortunately, we don't actually need to record "everything", as computers are (mostly) deterministic. that is, given the same inputs, they will produce the same outputs, which is kinda the whole point of computers, right. so when you have a deterministic machine like that, all you need to "record" is which program you executed and what inputs you gave to it. then you'll be able to perfectly reproduce the execution of that program by just running it again and providing the same inputs in the same order.
but as i hinted at with the word "mostly", computers aren't actually fully deterministic. a trivial example of this is the rdrand instruction on x86, whose sole purpose is to provide an unpredictable random value. similar issues are posed by file and network access (though arguably those could be seen as "inputs to the program"). and perhaps less obviously, multi-threaded execution is another source of non-determinism. even in well synchronized programs, there's generally no guarantee which thread is allowed to enter a critical section first, for example. but fear not, we'll solve all these problems with my favorite problem solving strategy: just not having the problem.
enter WebAssembly. given that wasm was designed to be sandboxed by default, it almost can't help but be deterministic. i say almost because some things like NaN-propagation are not guaranteed to be deterministic by the spec. but in practice, if you run the same wasm program on the same machine with the same inputs, you will get the same outputs. because everything else that can result in non-deterministic behavior has to come from outside the wasm instance and pass through a well defined host api. the host can write values to wasm memory or wasm globals, call wasm function, and provide host functions to be called by wasm from which it can return values. super straight forward. if you record all of those "host -> wasm" interactions as well as the wasm module you executed, then you can perfectly replay the execution of a wasm program. it didn't take me long to get this working, nor was i the only one in the handmade network with this idea.
early prototypes
after about a month of rewriting my wasm engine and implementing a basic gui library, i had the foundation in place: i was able to record and replay programs, and i had something to draw information on the screen. now the question was what to display.
one of my pet peeves is when people use new technologies to implement old ideas. a classic example of this is when application forms that used to be done on paper are "digitized". the most natural to do that is to just create a web page with text input elements for the blank slots of the physical document. there's nothing intrinsically wrong with this approach, but my issue is when people stop there and don't think about the opportunities that the new medium offers.
i once reworked the application form for my former high school. their initial version just had blank text fields for the course selection. this meant that the user had to know which combinations were valid and which courses existed in the first place. in my rework, i solved these problems by using select elements for the courses, and i made the form update the remaining options based on what was selected so far automatically. the system worked great!
so when it came to the design of my debugger, i wanted to avoid the mistake of throwing the new technology of time travel at the old idea of the step debugger. just adding the "go backwards" functionality wasn't enough for me.
but what should you do instead, how do you take full advantage of the opportunities of new technologies? great question, i wish a had a solid answer 🌚. this is by no means a trivial problem, but a good starting point is to ask yourself: what can you do now that was impossible before?
the obvious answer is that time travel allows us to go backwards, which wasn't possible before. but this answer is actually still stuck in the old mindset. it assumes that, like a step debugger that's attached to a native process, we can only look at one state at a time. but this is no longer true! we can now look at any number of states at once and, for example, compare them: what changed about this data structure between here and there? or like with the print debugging idea from the previous section, we could replay the program, capture data over time, and then plot that. the general principle there is that we can now map time to space. and that's the idea that i started with.
my goal was to build an interface that would show the entire execution of the program from top to bottom. any point in time in the program would have a corresponding point in space in that interface. and you could scroll up and down to see what happened around that point in time. here's what i came up with:
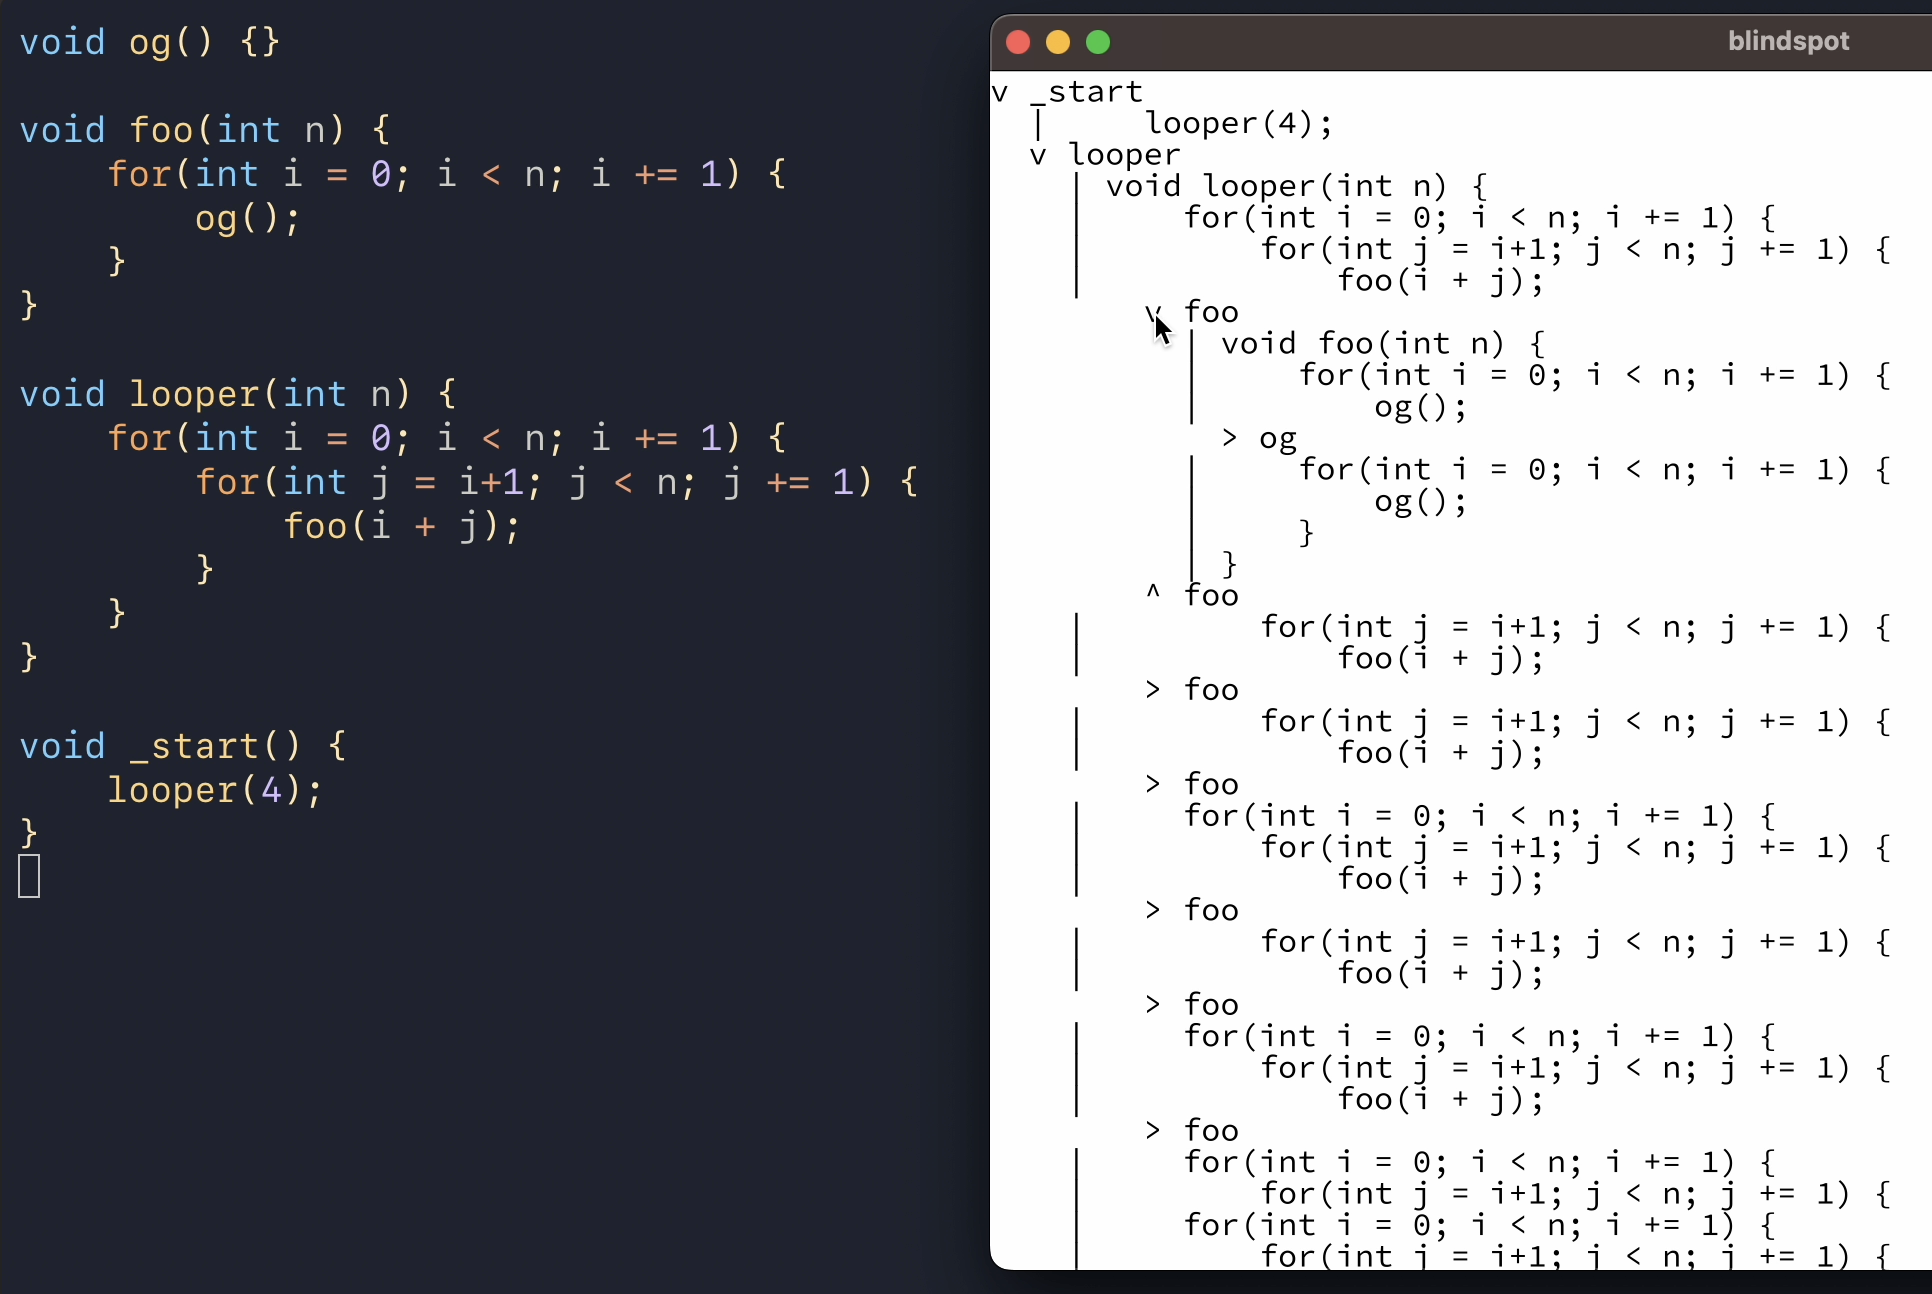
don't worry, it looks just as horrible and confusing to me as it does to you. it's just a prototype.
the idea here is that we start with the root function call to _start, draw its code, and whenever it calls another function (looper in this case), we allow the user to expand that call in place and draw that function's code, indented by one level. if there's a loop, the loop's body is repeated however many times the loop executed. most of the clutter in the ui comes from the loops being repeated without any visual hints like boxes around the iterations and iteration counts. pagination by default for loops would probably also be a good idea.
here's a screenshot of a later iteration of this interface where i added line numbers, file names, and inline buttons for the expandable function calls. the "we have a gui library at home" vibes are strong in this one:
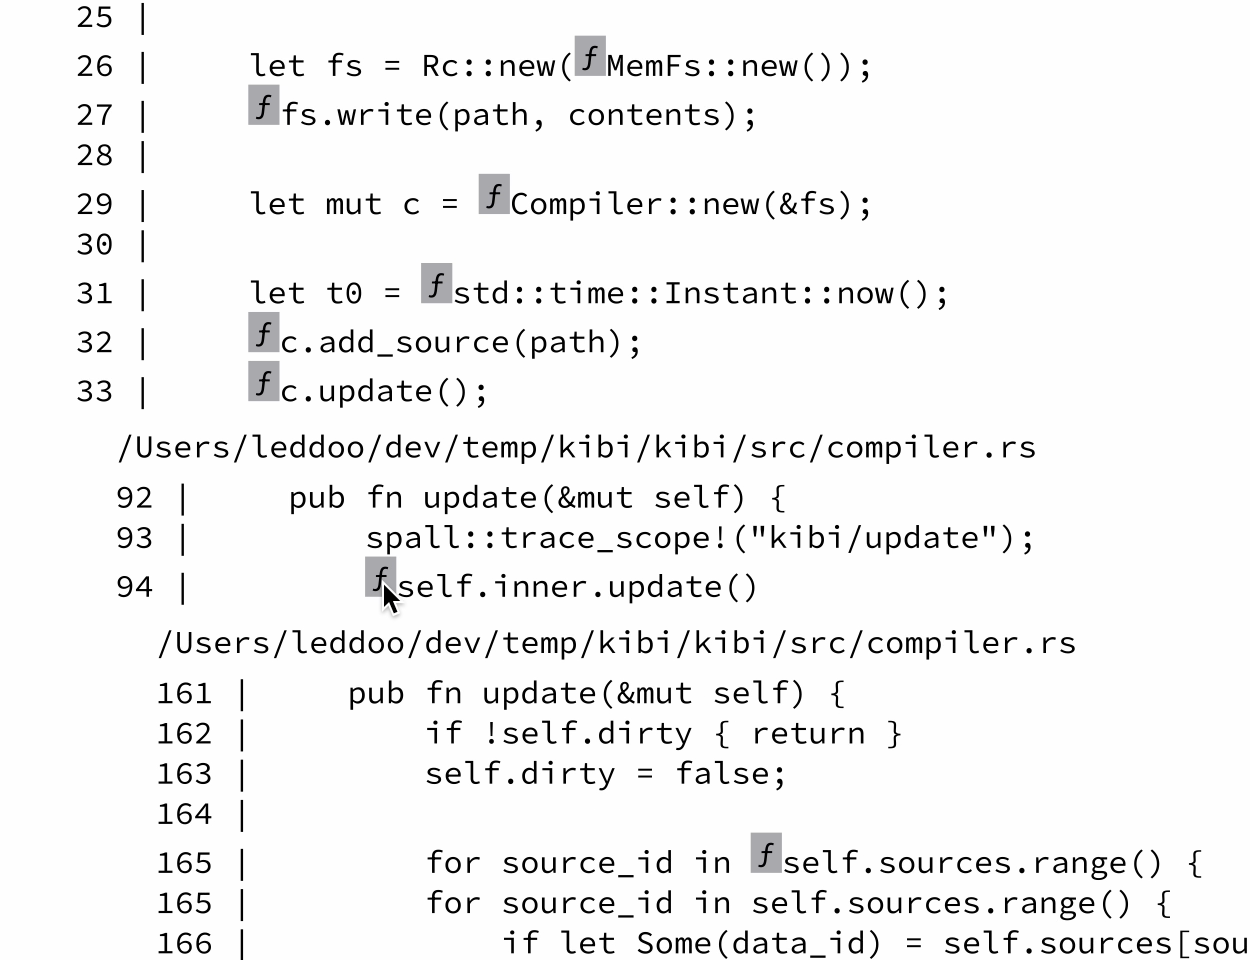
even though this interface was very primitive, i remember already using it to debug some issue with the debugger itself. something about being able to scroll through the execution made it easier to understand what my program was doing than if i added prints or used breakpoints.
but i quickly ran into a problem: computers are fast. the interface worked well for small test programs, but for larger programs, you could easily scroll for minutes or perhaps even hours (if my implementation could handle that). there was just too much information, and you could no longer get a quick overview of what the program did or where you were in the execution.
so next up, i added a timeline:
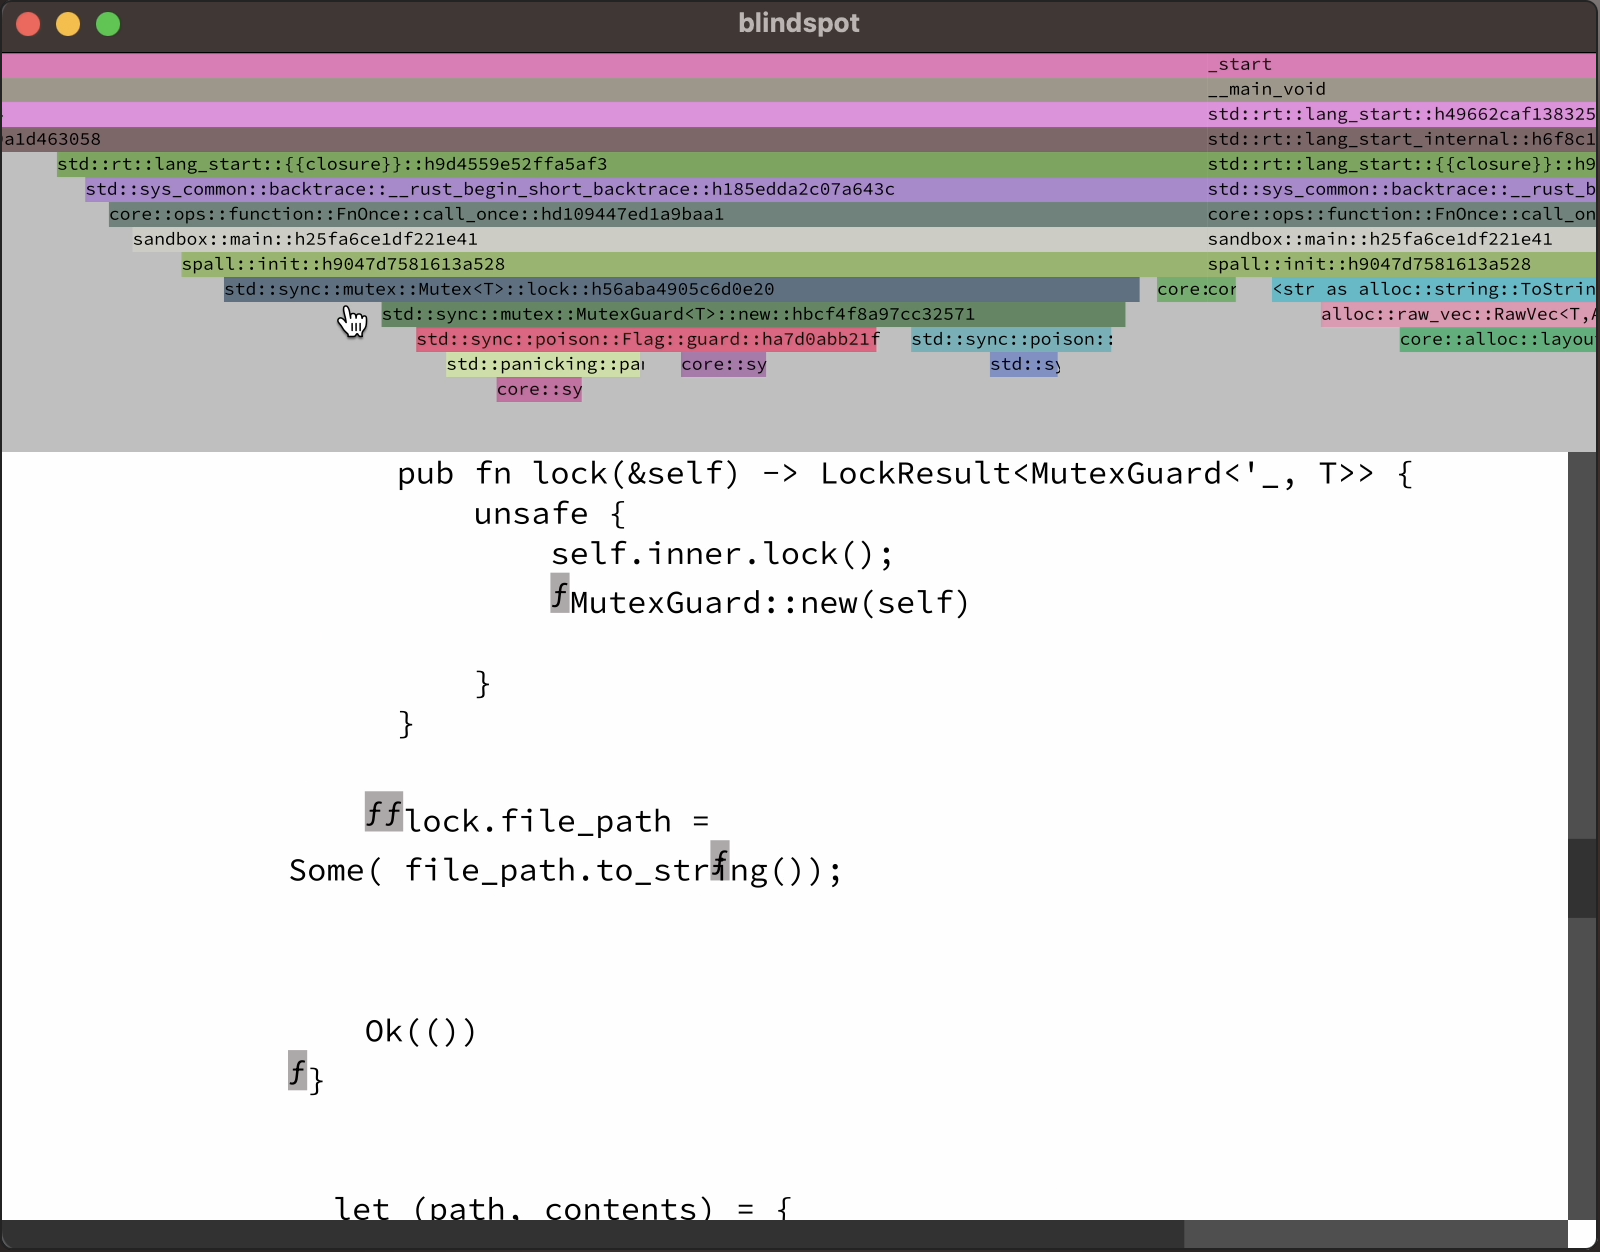
just, uh, ignore all the rendering glitches, will you? thanks!
the timeline now gave you a high level overview of the program's execution. you could zoom out to see everything, or you could zoom in, find some specific function call, then click on it, and the code view below would jump to that point in time.
the project was definitely going somewhere, but it was nowhere near usable as a real debugger (a theme that would continue to this day - ahem, foreshadowing). so far, i had only focused on visualizing control flow. there was no way to get even a single value out of the program. so for the upcoming visibility jam, my goal was to explore visualizing the memory state of programs.
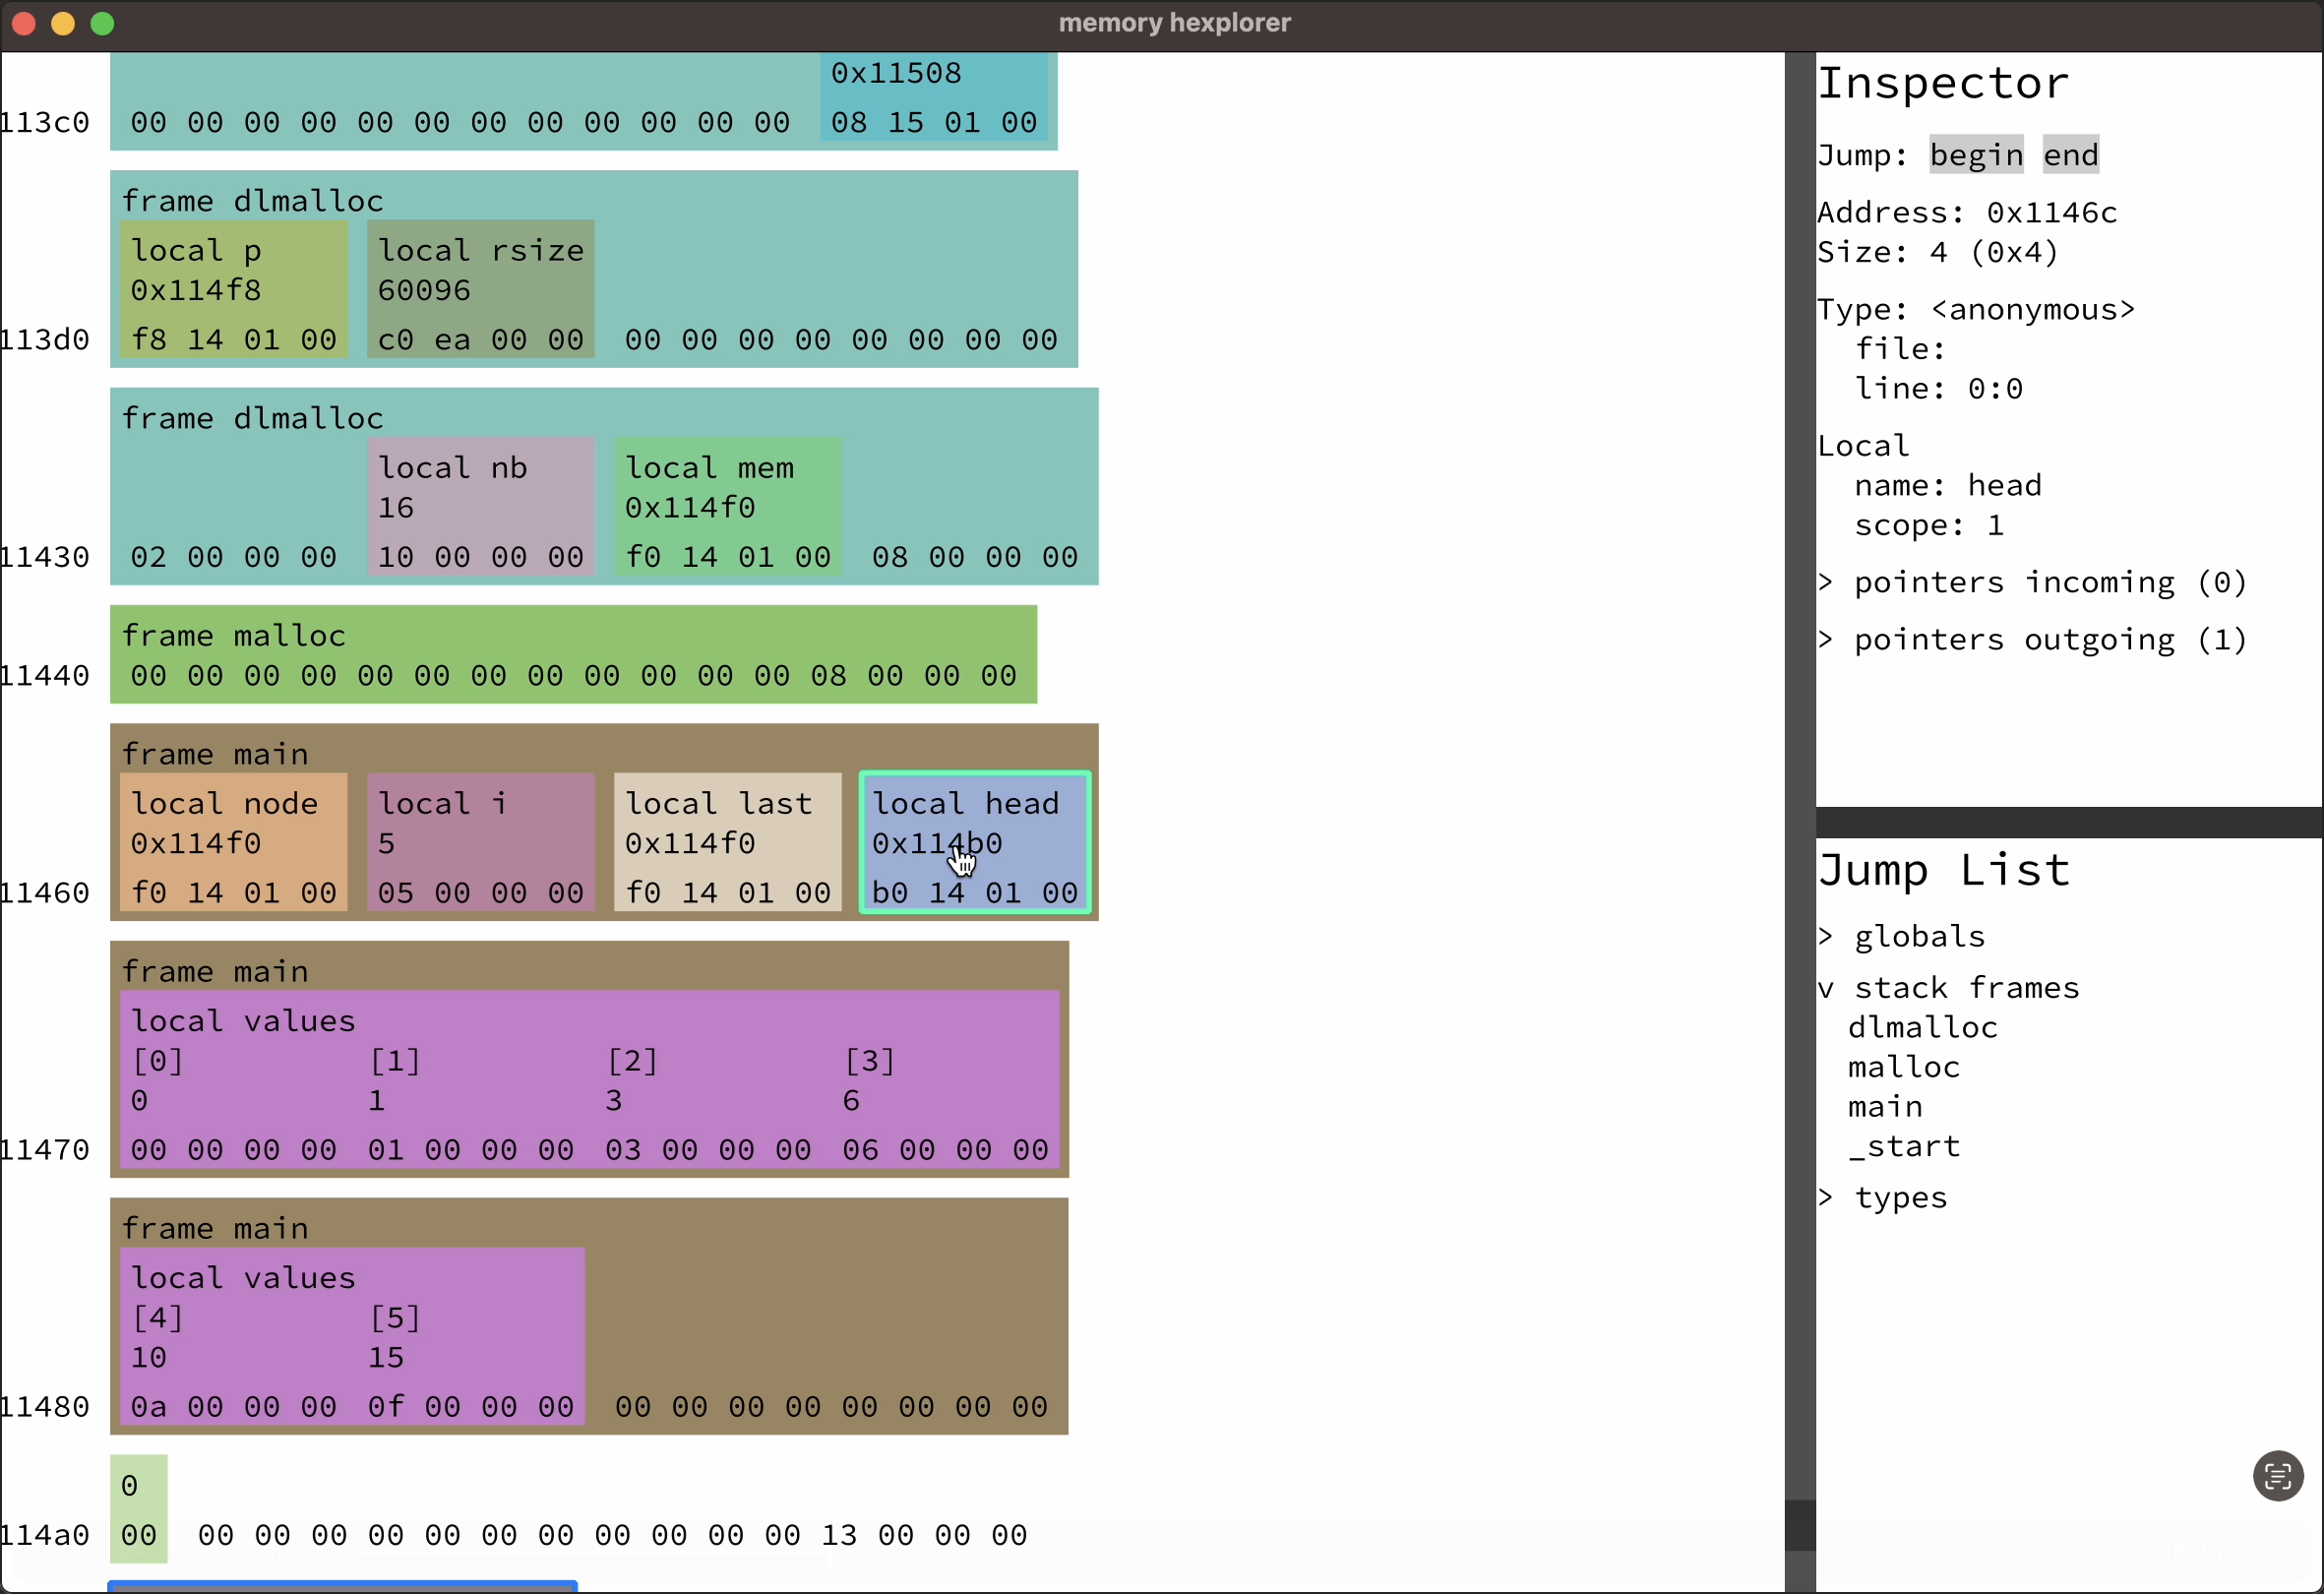
you can read more about that experiment over on the memory hexplorer project page, i also have some demo videos there. the basic idea was that i used debug info to visualize the data structures in memory. i started with globals and the local variables of functions in the callstack and recursively followed pointers from there.
like the code tree ui thing from earlier, the memory hexplorer was a very zoomed in look at memory. i imagine it would probably be a good idea to come up with an interface analogous to the timeline to get a high level overview. or simply draw this interface zoomed out with level of detail (like ben suggested on the jam recap stream, iirc).
switching to native
so what should you do when you have two working prototypes, one for visualizing control flow, and one for visualizing memory state? exactly, you should throw everything away, abandon wasm, and embark on a yearlong journey of getting back to where you were at the end of month one, but for native code.
look, we do these things not because they are easy, but because we thought they were going to be easy. never could i have guessed how much more complicated recording and replaying native code was going to be compared to wasm. but i sure as heck had to give it a try. because i actually didn't know a single person who shipped wasm professionally, and most of my own programs didn't even run on wasm. so supporting native programs was the clear winner from a business perspective. the only reason i hadn't done native from the start was because i didn't know whether it was actually possible (no, i didn't do my market research homework). but in retrospect, i'm glad that i started with wasm, because it allowed me to explore interesting ideas before diving into the deep end.
so after the visibility jam, about 5 months into the project, i started work on record/replay for native code. what platform? macos/aarch64. why? because that's what i use 🌚. someone should give me an award for making smart business decisions.
trying to deal with the sheer size of aarch64
alright, so let's get started with the story of going native. one of the things that makes wasm nice to work with is that it has a very small number of instructions, around 170 for the baseline version. adding simd support quickly makes that jump to around 440. but that still pales in comparison to aarch64, which, depending on how you count, has around 2000-4000 instructions for baseline + simd.
there are several different approaches to record/replay for native code, but for now it's enough for you to know that the approach i use requires me to implement an interpreter for all those 2000-4000 instructions. naturally, i wasn't going to do that by hand. but that doesn't mean that the approach i went with instead was any better of an idea. see, arm specifies their instruction set in a programming language called ASL. it looks something like this:
integer d = UInt(Rd);
integer n = UInt(Rn);
integer datasize = if sf == '1' then 64 else 32;
bits(datasize) imm;

case sh of
    when '0' imm = ZeroExtend(imm12, datasize);
    when '1' imm = ZeroExtend(imm12:Zeros(12), datasize);

bits(datasize) result;
bits(datasize) operand1 = if n == 31 then SP[] else X[n];

(result, -) = AddWithCarry(operand1, imm, '0');

if d == 31 then
    SP[] = result;
else
    X[d] = result;
that's the definition of the add immediate instruction.
so what do you think someone who's worked on programming languages for a few years thinks when he sees that? "i could write a compiler for that," of course. and that's precisely what i did.
5,232 lines later and you wouldn't believe it. it actually kinda worked. i was able to execute the first two instructions of a real program. unfortunately, most programs are more than two instructions long, and my interpreter wasn't going to do much more than that, not with this approach at least. (also, i'm kinda glad it didn't work out, cause that ASL code sorta has a proprietary license, and yeah, i wasn't planning on getting sued for this.)
but before we move on, a few more words about what the idea here was. cause you can probably imagine that interpreting that entire code up there for a single add instruction would be very slow compared to the single cycle that the hardware can do an addition in. so my plan was to optimize that code, and i was going to optimize it so hard that it would just fold back into the original instruction. i mean, we can dream, right? (btw, this whole approach was in part inspired by deegen)
another benefit of this approach would have been that it was cross platform. so i would have been able to replay an aarch64 recording on an x86 machine. an idea that i've finally let go of a few months ago. but at the current point in the story, i was still fixed on getting cross platform replay working at some point. and because i just wanted to get something, anything running, i wrote an interpreter by hand in rust.
here's a screenshot of that interpreter executing the first 156k instructions of a real program, making it to the first syscall (mprotect):
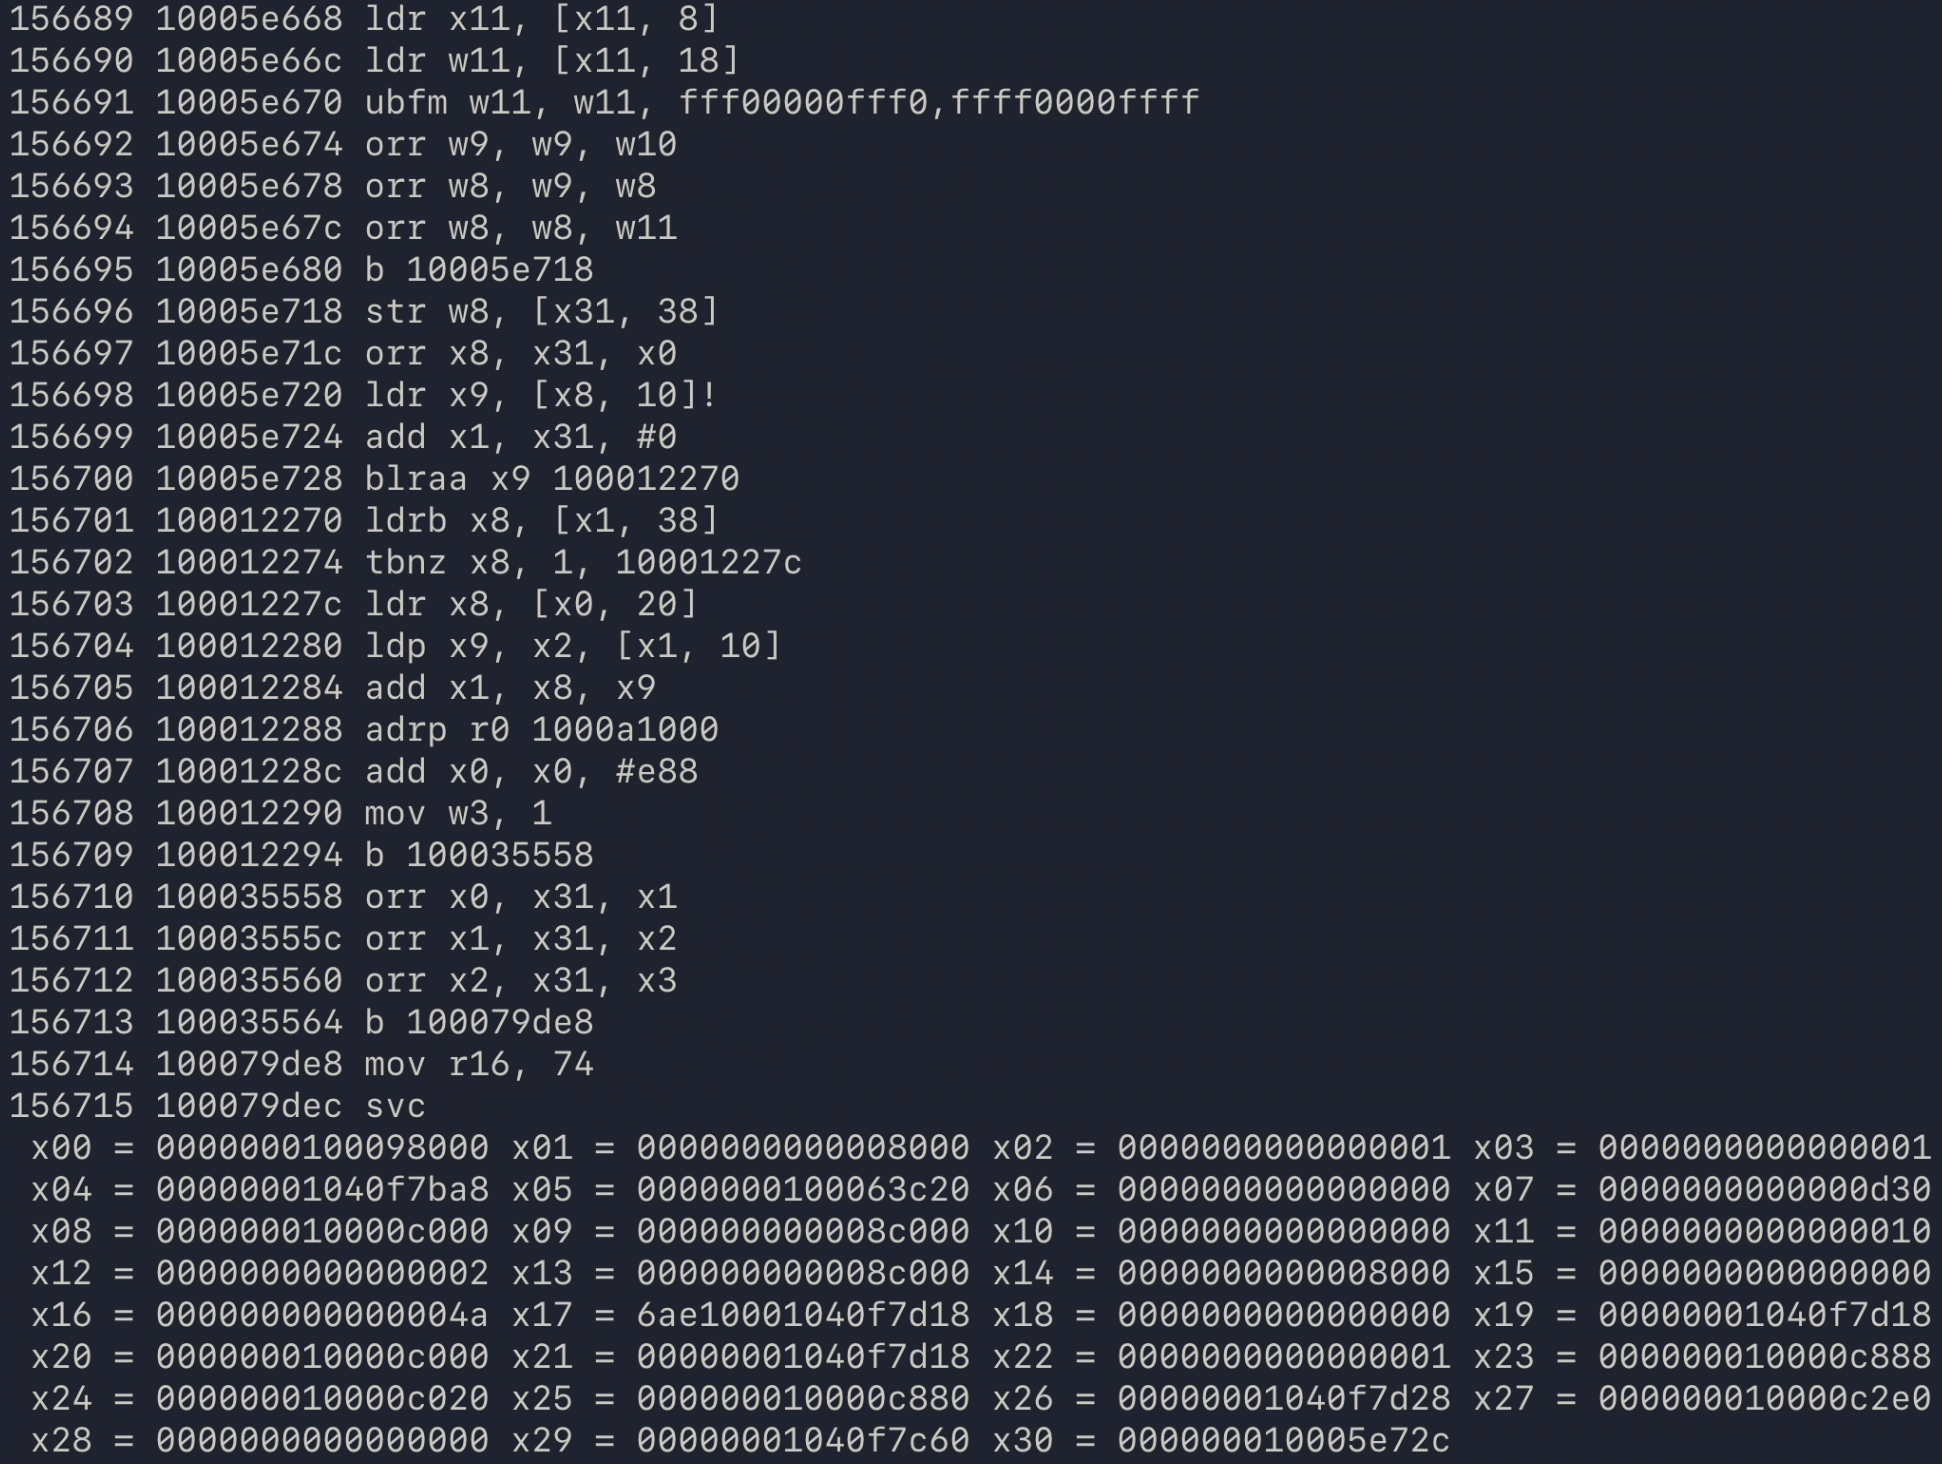
fast forward a few months and i had a working record/replay system for native code. there weren't many programs i was able to run, but hello world, lua, and even clang -c worked, as long as you didn't stray from the code paths that i had painstakingly implemented support for with my bare hands.
a cli debugger
next up, i implemented a very basic cli step debugger:
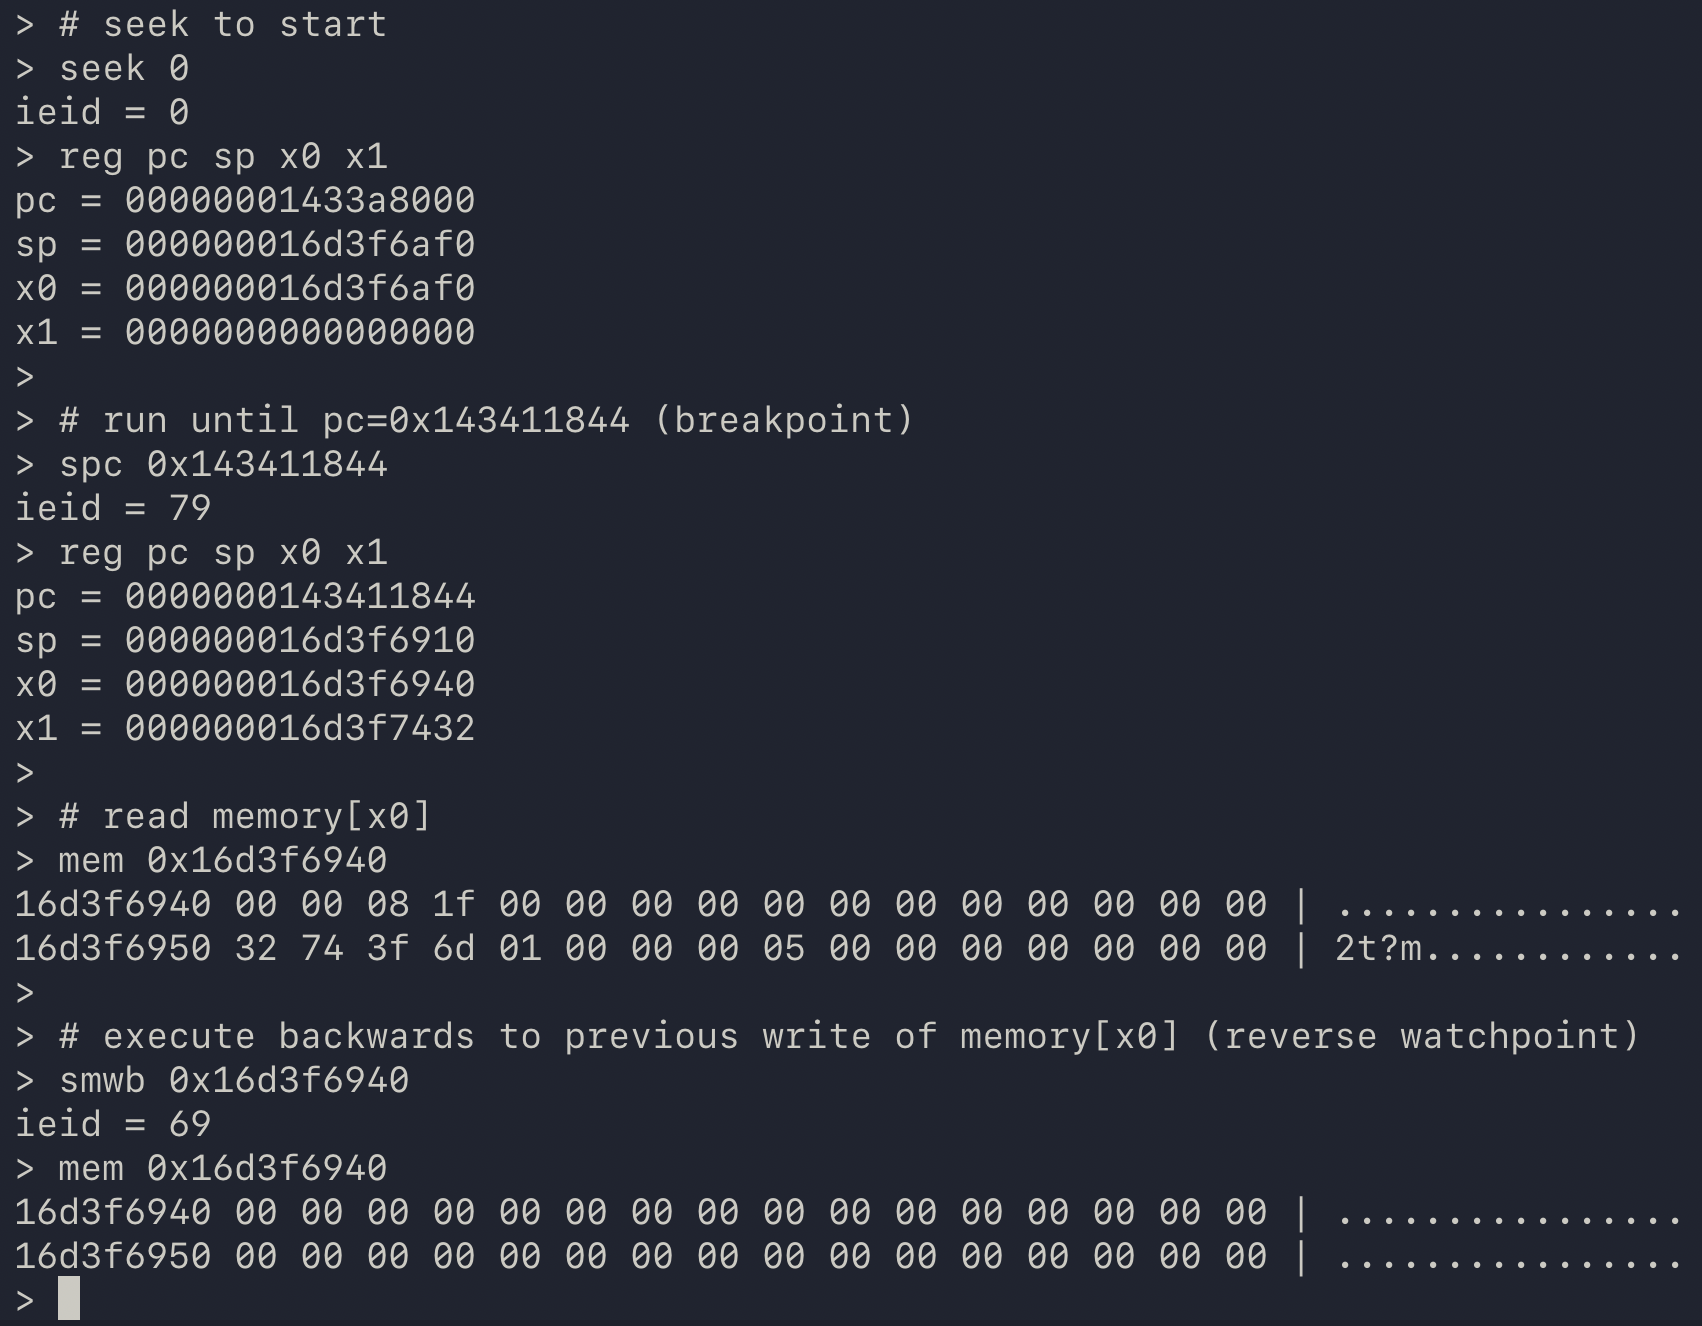
it could do most of the important things for a step debugger: you could seek to any instruction, you could step forwards and backwards, you could run until some address was executed (ie set a breakpoint) or until some address was written to (ie set a watchpoint).
i hadn't implemented support for debug info yet, but that didn't matter, as the cli debugger wasn't long for this world anyway. it was based on an interesting "technological" idea, but ultimately, that also ended up being its achilles heel.
i came up with a data format that allowed me to actually execute the program both forwards and backwards. and i don't mean going backwards by jumping back to the start and executing one instruction less. no, this data format encoded the "effects" of each instruction in a way where they could be applied forwards and backwards (xor, iykyk). but it ended up requiring around 10 bytes per instruction, and as we talked about a while ago, at billions of instructions per second, that puts us into the 10s of gigabytes per second range, which is just not feasible.
what functions?
No you don't know what you've got
Until it's gone– Linkin Park
sometimes we have to lose things before we can truly appreciate them. one such thing was knowing what code i was executing, back when i used wasm. and by that i don't mean that i now use a crap ton of libraries. what i mean is that wasm code comes bundled in wasm modules. each module contains a list of functions. so when you run a wasm module, those functions are the only code you have to be concerned with. like for example, when showing the user which function is currently executing - it can only be one from that list.
but wasm is just "assembly for the web", how much more difficult could this be for real native code? turns out, a lot.
first off, native code can be loaded and unloaded at runtime. game developers sometimes use this to tweak their code while the game is running. for a regular step debugger, this isn't really an issue. debuggers get notified by the OS whenever the loaded modules change. then you can just parse the current list of modules, and voila, you know which functions there are. as a time travel debugger, this gets slightly more complicated, as the answer to the question of which functions there are now depends on when that question was asked. though this is at most a minor inconvenience. at least, until we talk about jitting.
see, native code is just data. nothing stops you from writing a bunch of bytes to some memory buffer, marking it as executable, and telling the cpu to execute it. of course, if you don't know what you're doing, that will most likely just crash your program. but if you do it with skill, we call it jit compilation. unfortunately, not all jits tell the operating system about the functions they generate. and because there's generally no way to tell where one function begins and another one ends based only on the current program counter, debuggers will usually just throw their hands up when you stop in jitted code and say "well, we're at address 0x19211cb44, and these are the next instructions we'll execute. sorry, that's all i know."
but no problem, we don't actually care about the jitted code, that's written in assembly, and who wants to read that. let's just go up the callstack, back to the C code we're familiar with. uh, what do you mean we can't do that? well, sometimes it is possible, but not always. thing is, on wasm, the callstack is a real thing which lives outside the wasm memory, somewhere in the wasm engine's internal data structures, so you can always find the callers. on native however, the callstack is nothing but a convention. usually, a register known as the frame pointer (fp on aarch64, rbp on x86) holds the address of the base of the current stack frame, and there, a copy of the caller's frame pointer and return address (lr) is saved. this forms a linked list of active functions:
    ### main's stack frame:
              saved fp   saved lr
.-> 0x123400  0x0        0x0       // bottom of stack.
|   0x123410  variables
|
|
|   ### foo's stack frame:
'-            saved fp   saved lr
.-> 0x123420  0x123400   main+16
|   0x123430  variables
|   0x123440  more variables
|
|
|   ### bar's stack frame:
'-            saved fp   saved lr
.-> 0x123450  0x123420   foo+120
|   0x123460  stuff
|
|
|   ### registers
|   pc = bar+8
'-  fp = 0x123450
but using the fp register as the head of this linked list is just a convention. apple does ask you to respect it on their platform, but the police won't come knocking down your door if you don't. my own jit that i wrote for the debugger does not follow this convention, and i haven't had to use my get out of jail free card yet. though it does mean that debuggers like lldb can't correctly reconstruct the callstack when the program is stopped in my jitted code. and that's a problem i'd like to avoid with my debugger.
who needs debug info, anyway
at this point, it's probably no secret that i'm breaking every rule in the tech startup playbook. but so what, i'm having fun along the way, and isn't that the whole point? one of the rules is that you're supposed to have one clear avatar and one clear problem that you're solving for them. which i did. it was system programmers on macos/aarch64, who worked on complex problems and needed better tools to understand what their code was doing.
but as i kept working on this thing, i realized that it could also be really useful for reverse engineering. as george hotz, who built his own time travel debugger based on qemu, put it: "if you're running the binary 10 times less times than everybody else, it's quite helpful."
another advantage of dynamic tooling is that it knows what code did actually run. when a static disassembler runs into a virtual call, it generally does not know what the set of called functions can be. and when an obfuscated program uses some kind of "unpacking technique", where the real code is computed at runtime (kind of like in a jit compiler), a static tool may be missing the most important functions. though you can probably capture that dynamic data with another tool and feed it to your favorite static analyzer.
i basically have zero experience in reverse engineering, so take that previous paragraph with a grain of salt. so far, i've managed to avoid the RE rabbit hole quite well, but thinking about the reverse engineering use case has led me to an interesting design principle: make the debugger as useful as possible before using any debug info.
debug info tells the debugger what functions and types there are in the program, how to unwind the callstack, and much more. of course, for some things, like function and variable names, you cannot get around using debug info. but a surprising amount of information can actually be inferred just from the machine code alone.
by inspecting the branches in the executed machine code, you can mostly figure out where the functions are. this is because code that isn't obfuscated to the nth degree tends to use bl and ret instructions to call functions and return from them (call and ret on x86). that gives you the start and end points of functions, so if you take the closure over direct branches (b label, j label) and conditional branches (b.cc label, jcc label) between them, that gives you a decent approximation of a function's code. this is made slightly more complicated by jump tables and tail calls, but that's a topic for another time.
if that sounds somewhat complicated, that's because it is. and given that this is a debugger for debugging programs where debug info is available, doing that kind of bottom up analysis may seem entirely unnecessary. but remember the jit problem from the previous section? we don't necessarily know where jit functions begin and end, unless the jit tells us about that. if we can infer those jit function bounds from the machine code however, we don't need it to, and we'd be able to provide a nicer experience for debugging programs with jits out of the box. so that's the reason i went down this rabbit hole.
i like dataflow analyses 🚅
(heads up, technical section ahead)
okay great, so now we can infer where the functions are in the program without anyone's help. unfortunately that's not enough. while we can use this information to identify what function we're currently in, we can't necessarily reconstruct the other functions on the callstack. we talked about how there is this convention of the linked list of frame pointers and return addresses on macos, but we also talked about how that isn't always respected.
here's the thing though, most functions look like this (regular function):
// allocate stack space and save caller registers on the stack.
stp     x20, x19, [sp, -0x20]!  // this updates the sp
stp     fp, lr, [sp, 0x10]
add     fp, sp, #0x10           // <- frame pointer list head.

// function body.

// restore saved registers, free stack space, return.
ldp     fp, lr, [sp, 0x10]
ldp     x20, x19, [sp], 0x20    // this updates the sp
ret
or like this (leaf function):
// no stack setup.

// function body (does not call other functions).

// return.
ret
that is, most functions follow conventional patterns, so one strategy could be to just analyze the machine code and look for one of those patterns. of course, if a function uses a different pattern, that won't work. so let's use a slightly more advanced strategy: abstract interpretation.
we start at the entry point of the function, and we'll track a symbolic value for each register. at the start, each register will hold its initial value. for example, sp = sp_0. (the _0 suffix means "initial value")
the first instruction, stp x20, x19, [sp, -0x20]!, decrements the stack pointer by 0x20, and then stores the registers x20, x19 at that address. so the only register that changes is the stack pointer, and we record sp = sp_0 - 0x20.
for the purposes of unwinding, we also care about where the initial values of registers are stored. and because x20 and x19 weren't modified yet, we record loc[x20_0] = mem[sp_0 - 0x20] and loc[x19_0] = mem[sp_0 - 0x18]
now we just repeat that until we reach the function exit. and that is actually more or less what lldb does, when it doesn't have debug info.
there's just one problem: control flow.
	cbz x0, 1f       // if x0==0, jump to label 1
	add x0, x1, #2   // x0 = x1 + 2
	b 2f             // jump to label 2.
1:
	mov x0, x13      // x0 = x13
2:
here we either assign x0 = x1 + 2, or we assign x0 = x13. so what should the value of x0 be after the branch?
the compiler nerds are screaming "φ!" right now, but we don't really need that here. in my analysis, i just set x0 = ? after the branch.
lldb's analysis works slightly differently. iiuc, its answer is x0 = x1 + 2. no, it's not a particularly advanced analysis.
but the control flow problem actually gets even worse when there are loops:
1:
	cmp x4, 7         // compare x4 to 7
	b.hs 3f           // if x4 >= 7, jump to label 3
2:
	add x5, x5, #1    // increment x5
	ldr x4, [x7, x5]  // something else
	b 1b              // jump back to label 1 (continue looping)
3:
here's what the control flow graph for that snippet looks like:
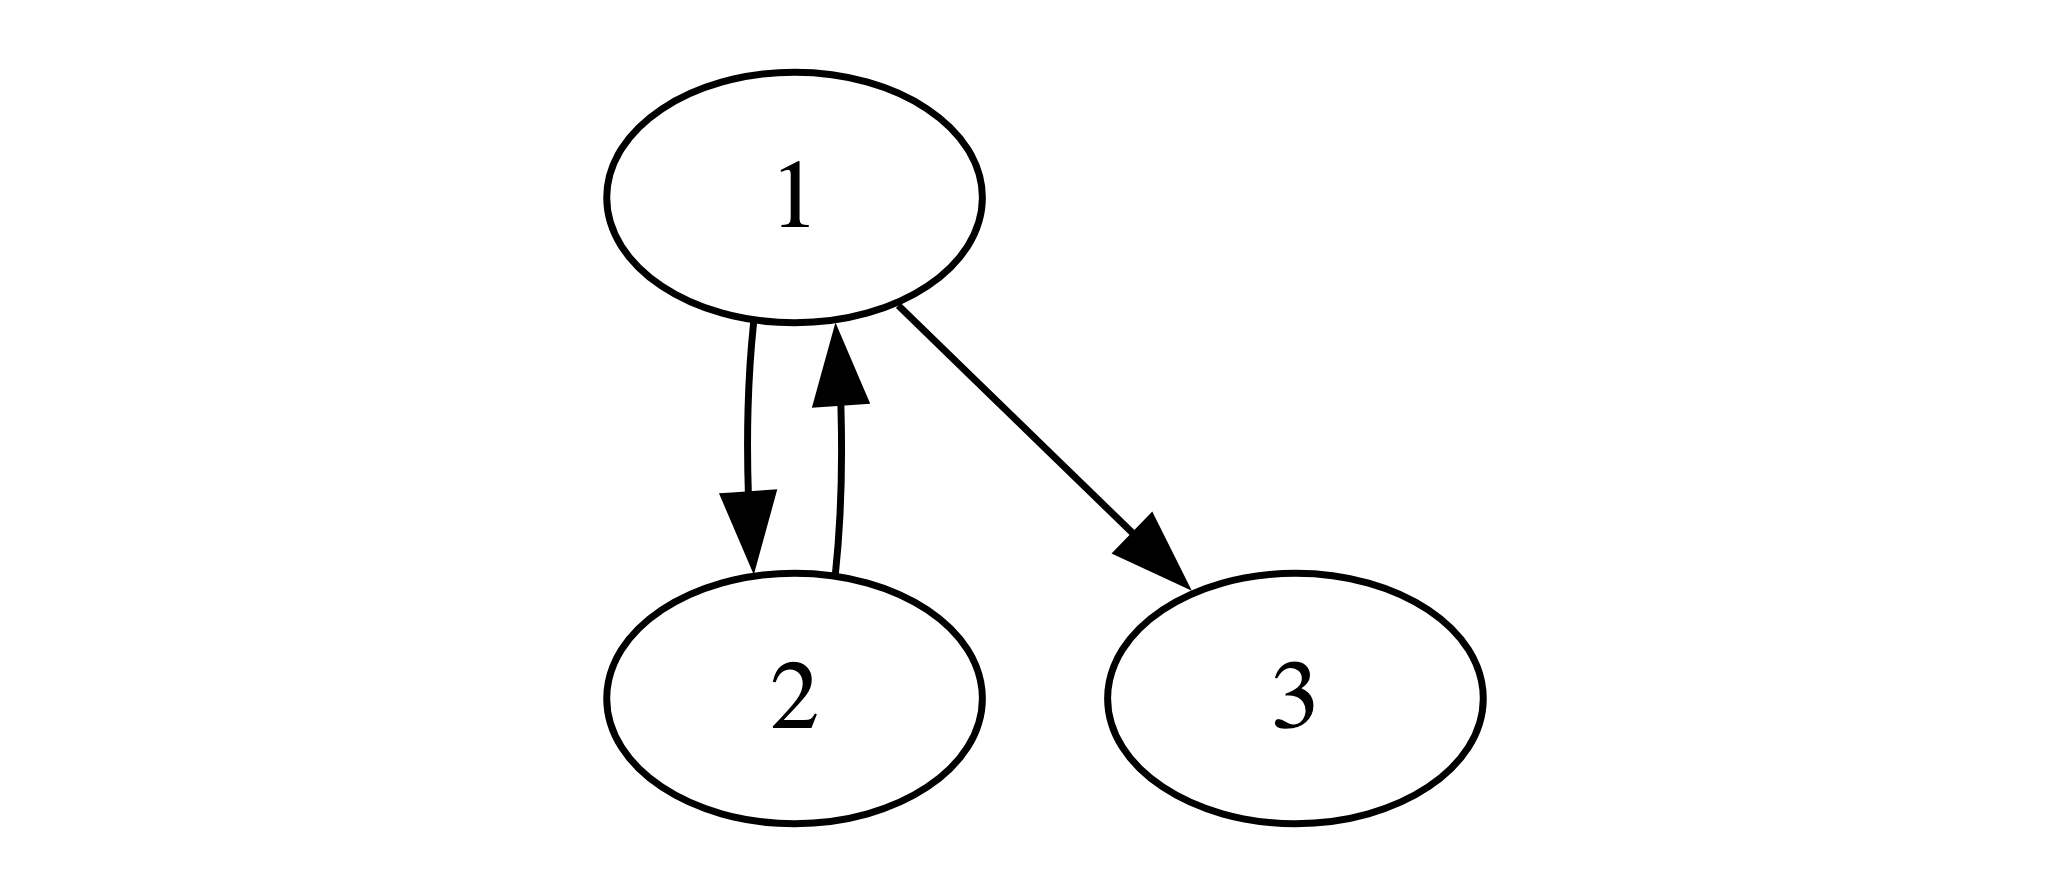
let's see what the abstract value of the register x5 is, as we explore this control flow graph.
initially, upon entry to label 1, let's say x5 holds its initial value: x5 = x5_0.
this value is propagated to the successors 2 and 3.
then we explore label 2. that increments x5, so now we have x5 = x5_0 + 1 at the end of label 2.
this value is propagated to the successor 1. but uh oh! we already have a value here: x5 = x5_0, and that's different, so now we have to collapse x5 = ?.
but we already told label 3 that x5 = x5_0... so we now have to go and tell it "my bad, we actually don't know what x5 holds." and label 3 would then have to propagate that to its successors, and so on.
so we actually have ourselves a nice little dataflow analysis here! (i would put a link to learn more about data flow analyses here, but i assume the wikipedia article won't be particularly helpful. so just google it on youtube or something)
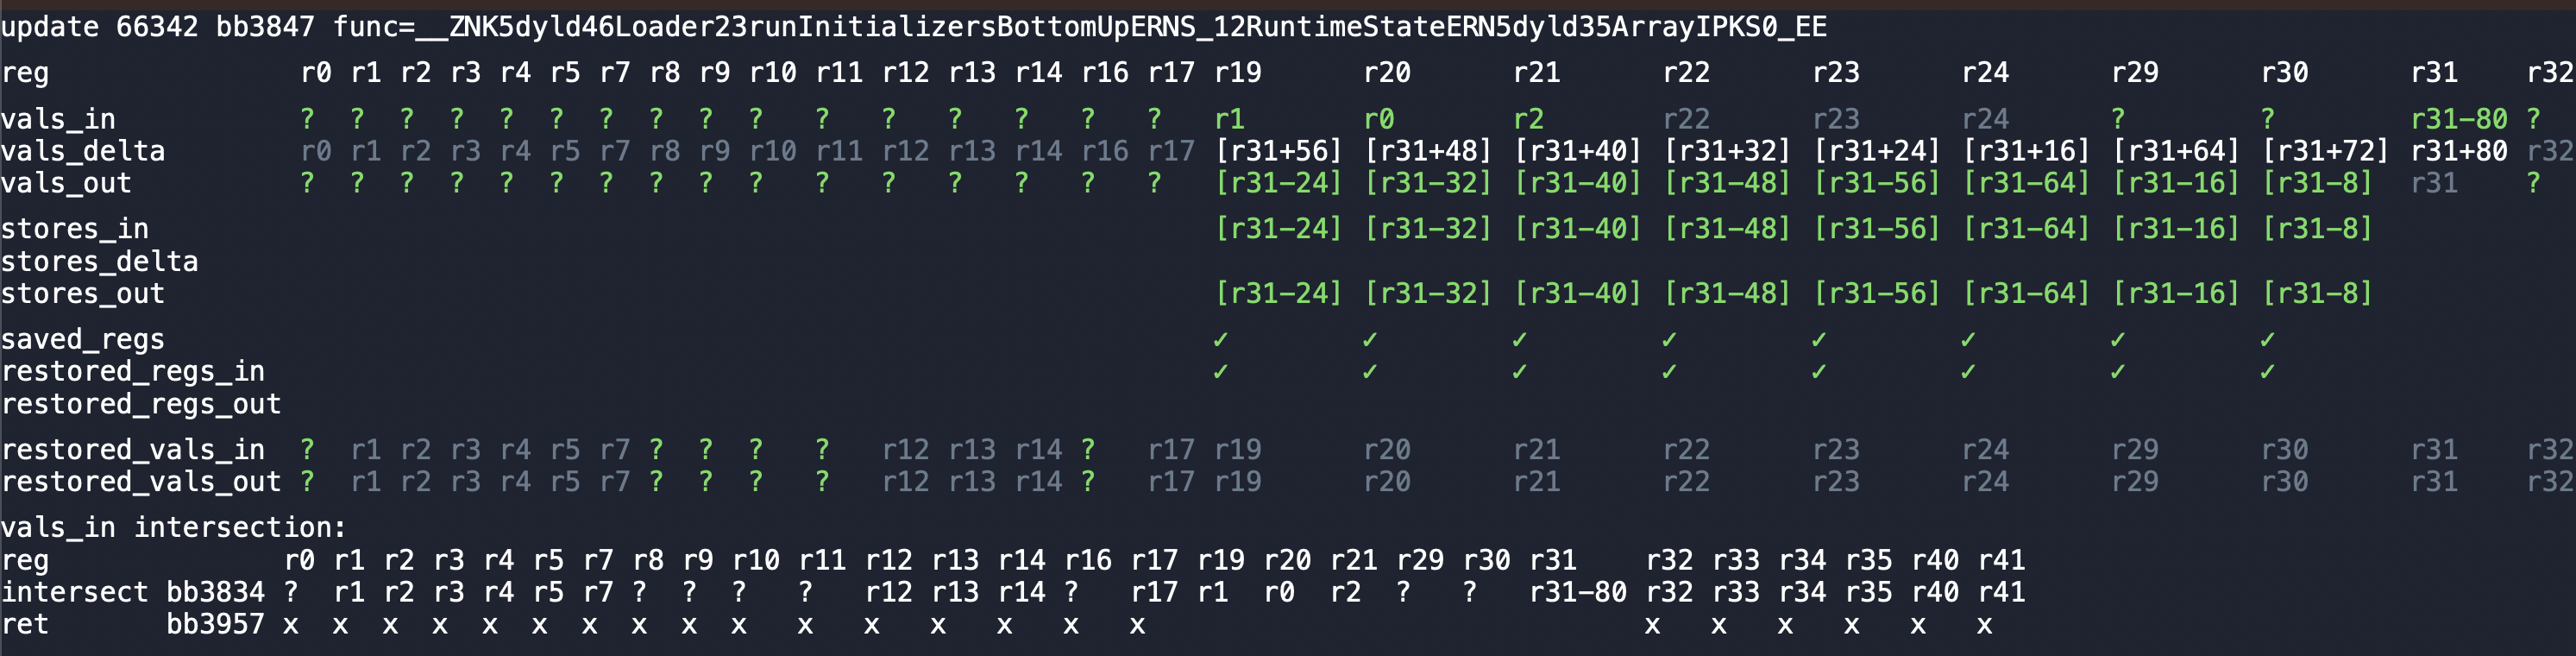
though "little" doesn't describe my implementation particularly well. version 1 was around 2 kloc, and it got so complicated that i needed to build a custom debugger for it:
present day
we've almost made it through the first 1.5 years! there are still quite a few things we haven't talked about, like the challenges of recording and replaying native code, accelerating everything with a custom jit, and the crazy ways i now cope with the 2000-4000 aarch64 instructions. but i've probably already lost > 90% of readers, so let's bring this thing in to land.
a few weeks ago, i built another prototype for the 2025 wheel reinvention jam: asm-trace. it was an attempt at building an interface like the "call tree thing" i made for wasm way at the beginning. you can check that out (or one of the many other things i've linked) if you want more right now.
currently i'm rewriting the record/replay system for about the 3rd time. then the plan is to implement more solid versions of those machine code analyses i described above (function & unwind inference). and after that, the focus will be to get an mvp out the door. at least, that's the current plan. my plans tend to change 🌚
to be notified about future blog posts, you join the discord
alright, that's it!