
Reasoning about optimized code can be tricky as the compiler is able to do all sorts of transformations to it, which can feel finicky and unpredictable to the programmer. This project aims to provide an environment where many optimizations as well as data dependencies are in the programmer's control and visualized so they can better reason about their program. This tool would likely be used for parts of the program that are under high scrutiny, such as computation-heavy portions.
I believe that using a node-graph is a good tool to communicate the intricacies of a program, such as the data dependency chains. I felt that trying to translate a textual language such as C to a graph would be a rather unstable transformation and increase iteration time. By making the programmer edit a node-graph themselves, the editing version and optimized version of the program are more-or-less the same language. Keeping both representations graphical allows the optimized version of the program resemble the unoptimized version. This familiarity makes applying the information gathered from the optimized program to the editing version easier.
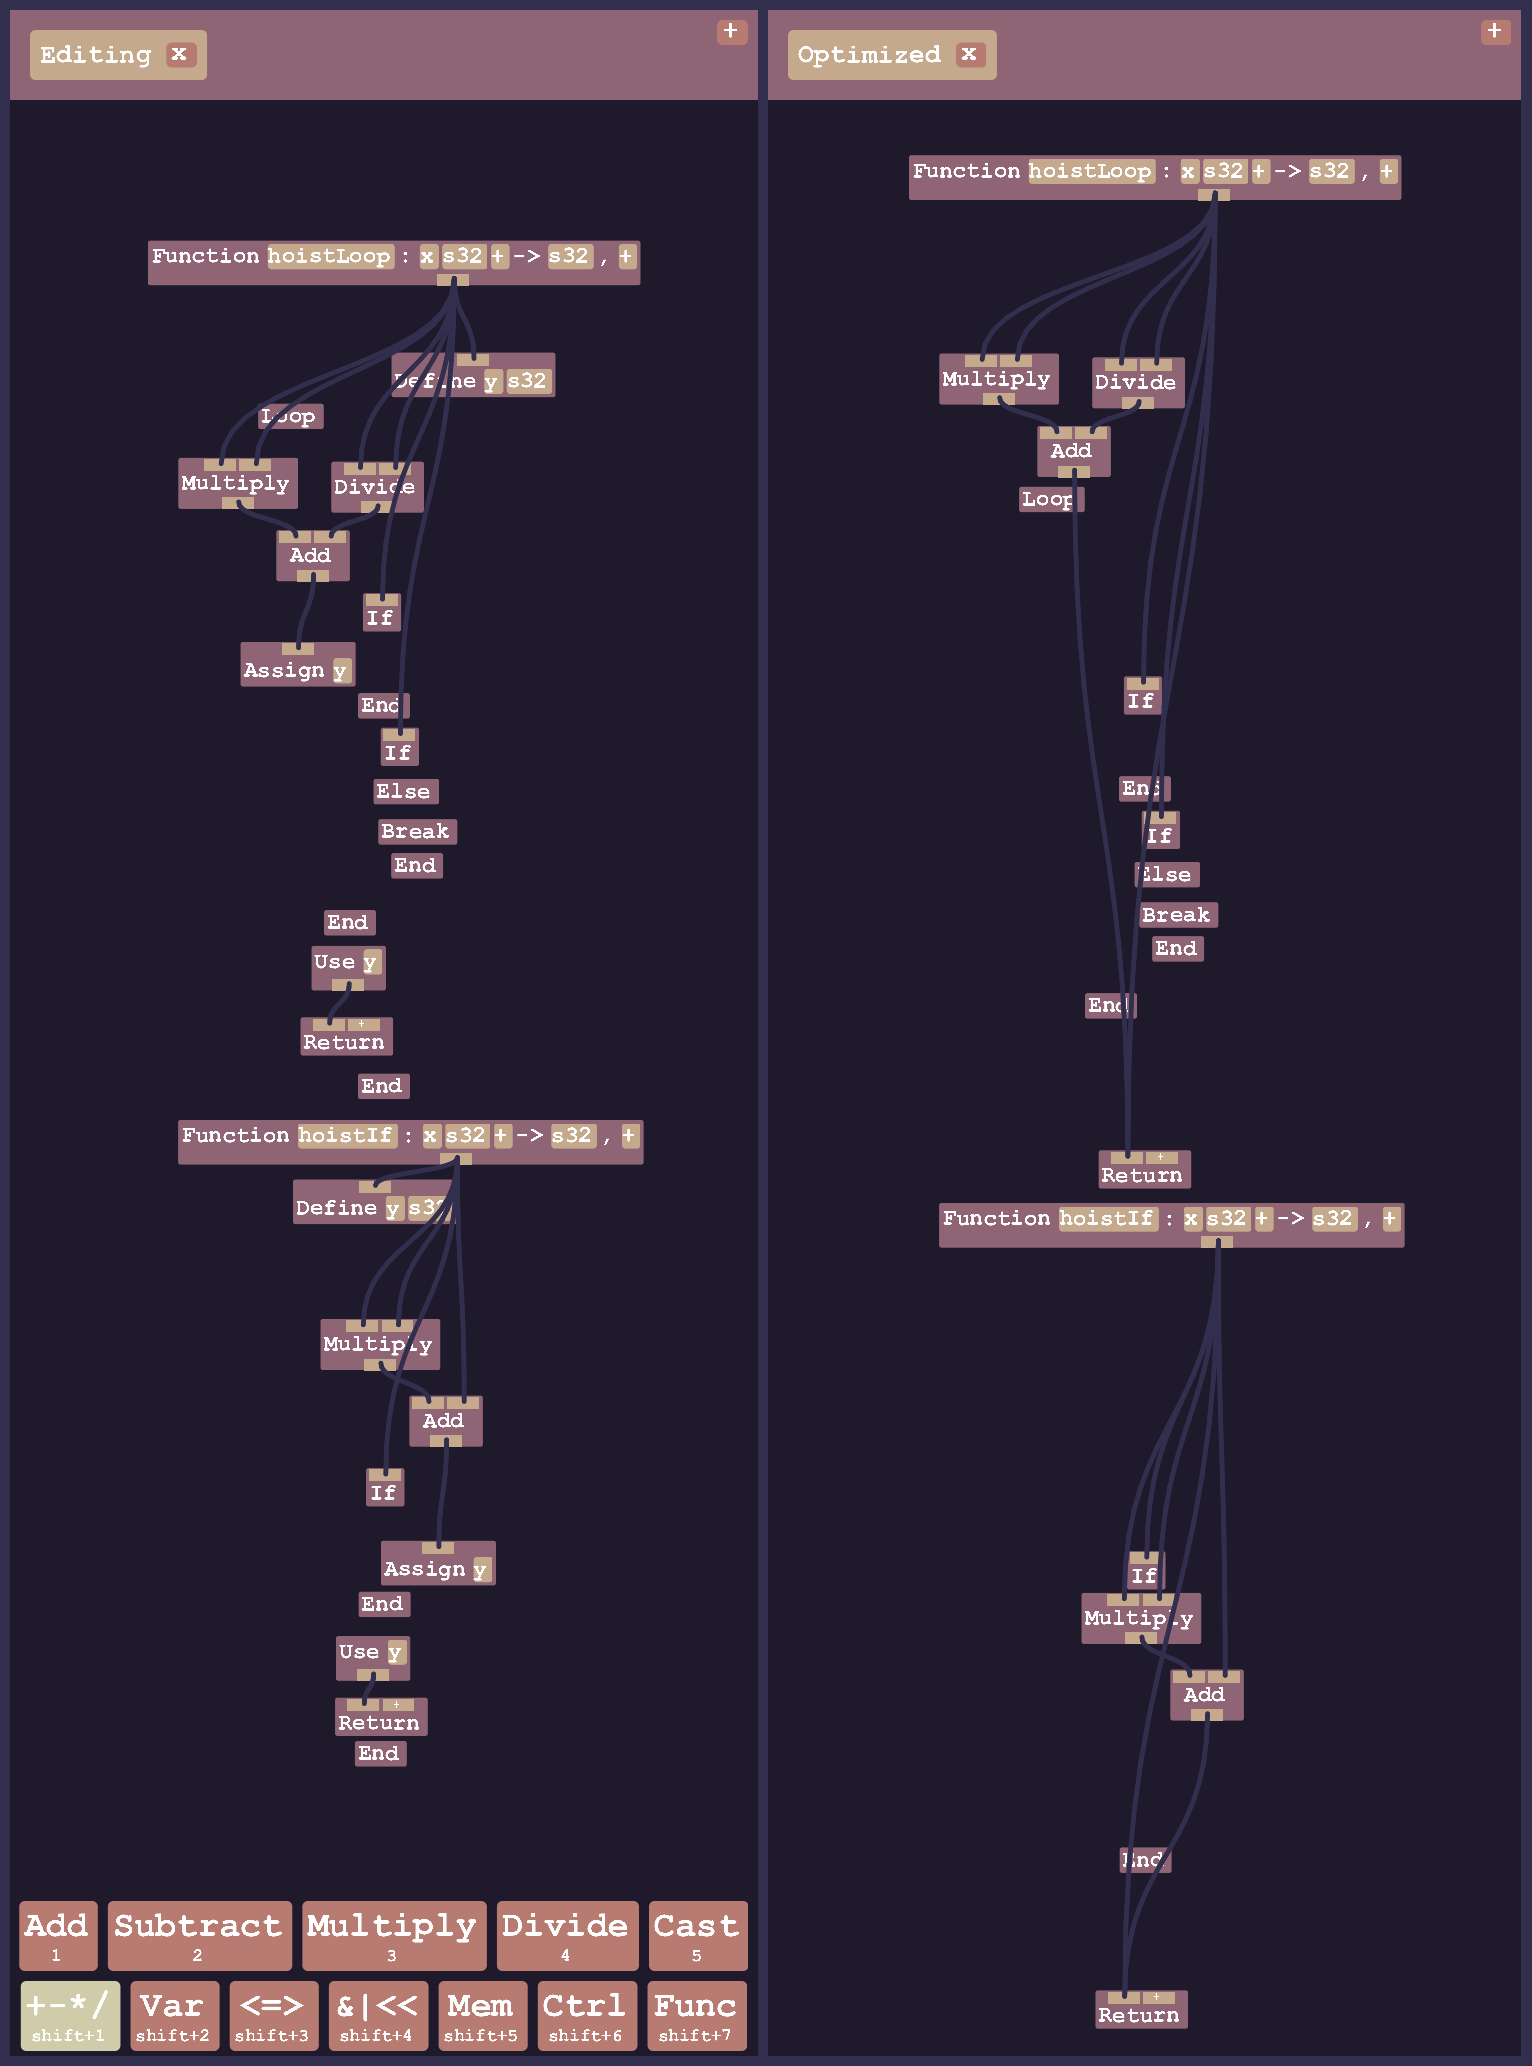
This is an example of visualizing transformations that move computations into better areas. The top function moves some computation before a loop, even though the programmer put it inside of the loop. The bottom function moves computation into an if statement, when the programmer put it before the if statement.
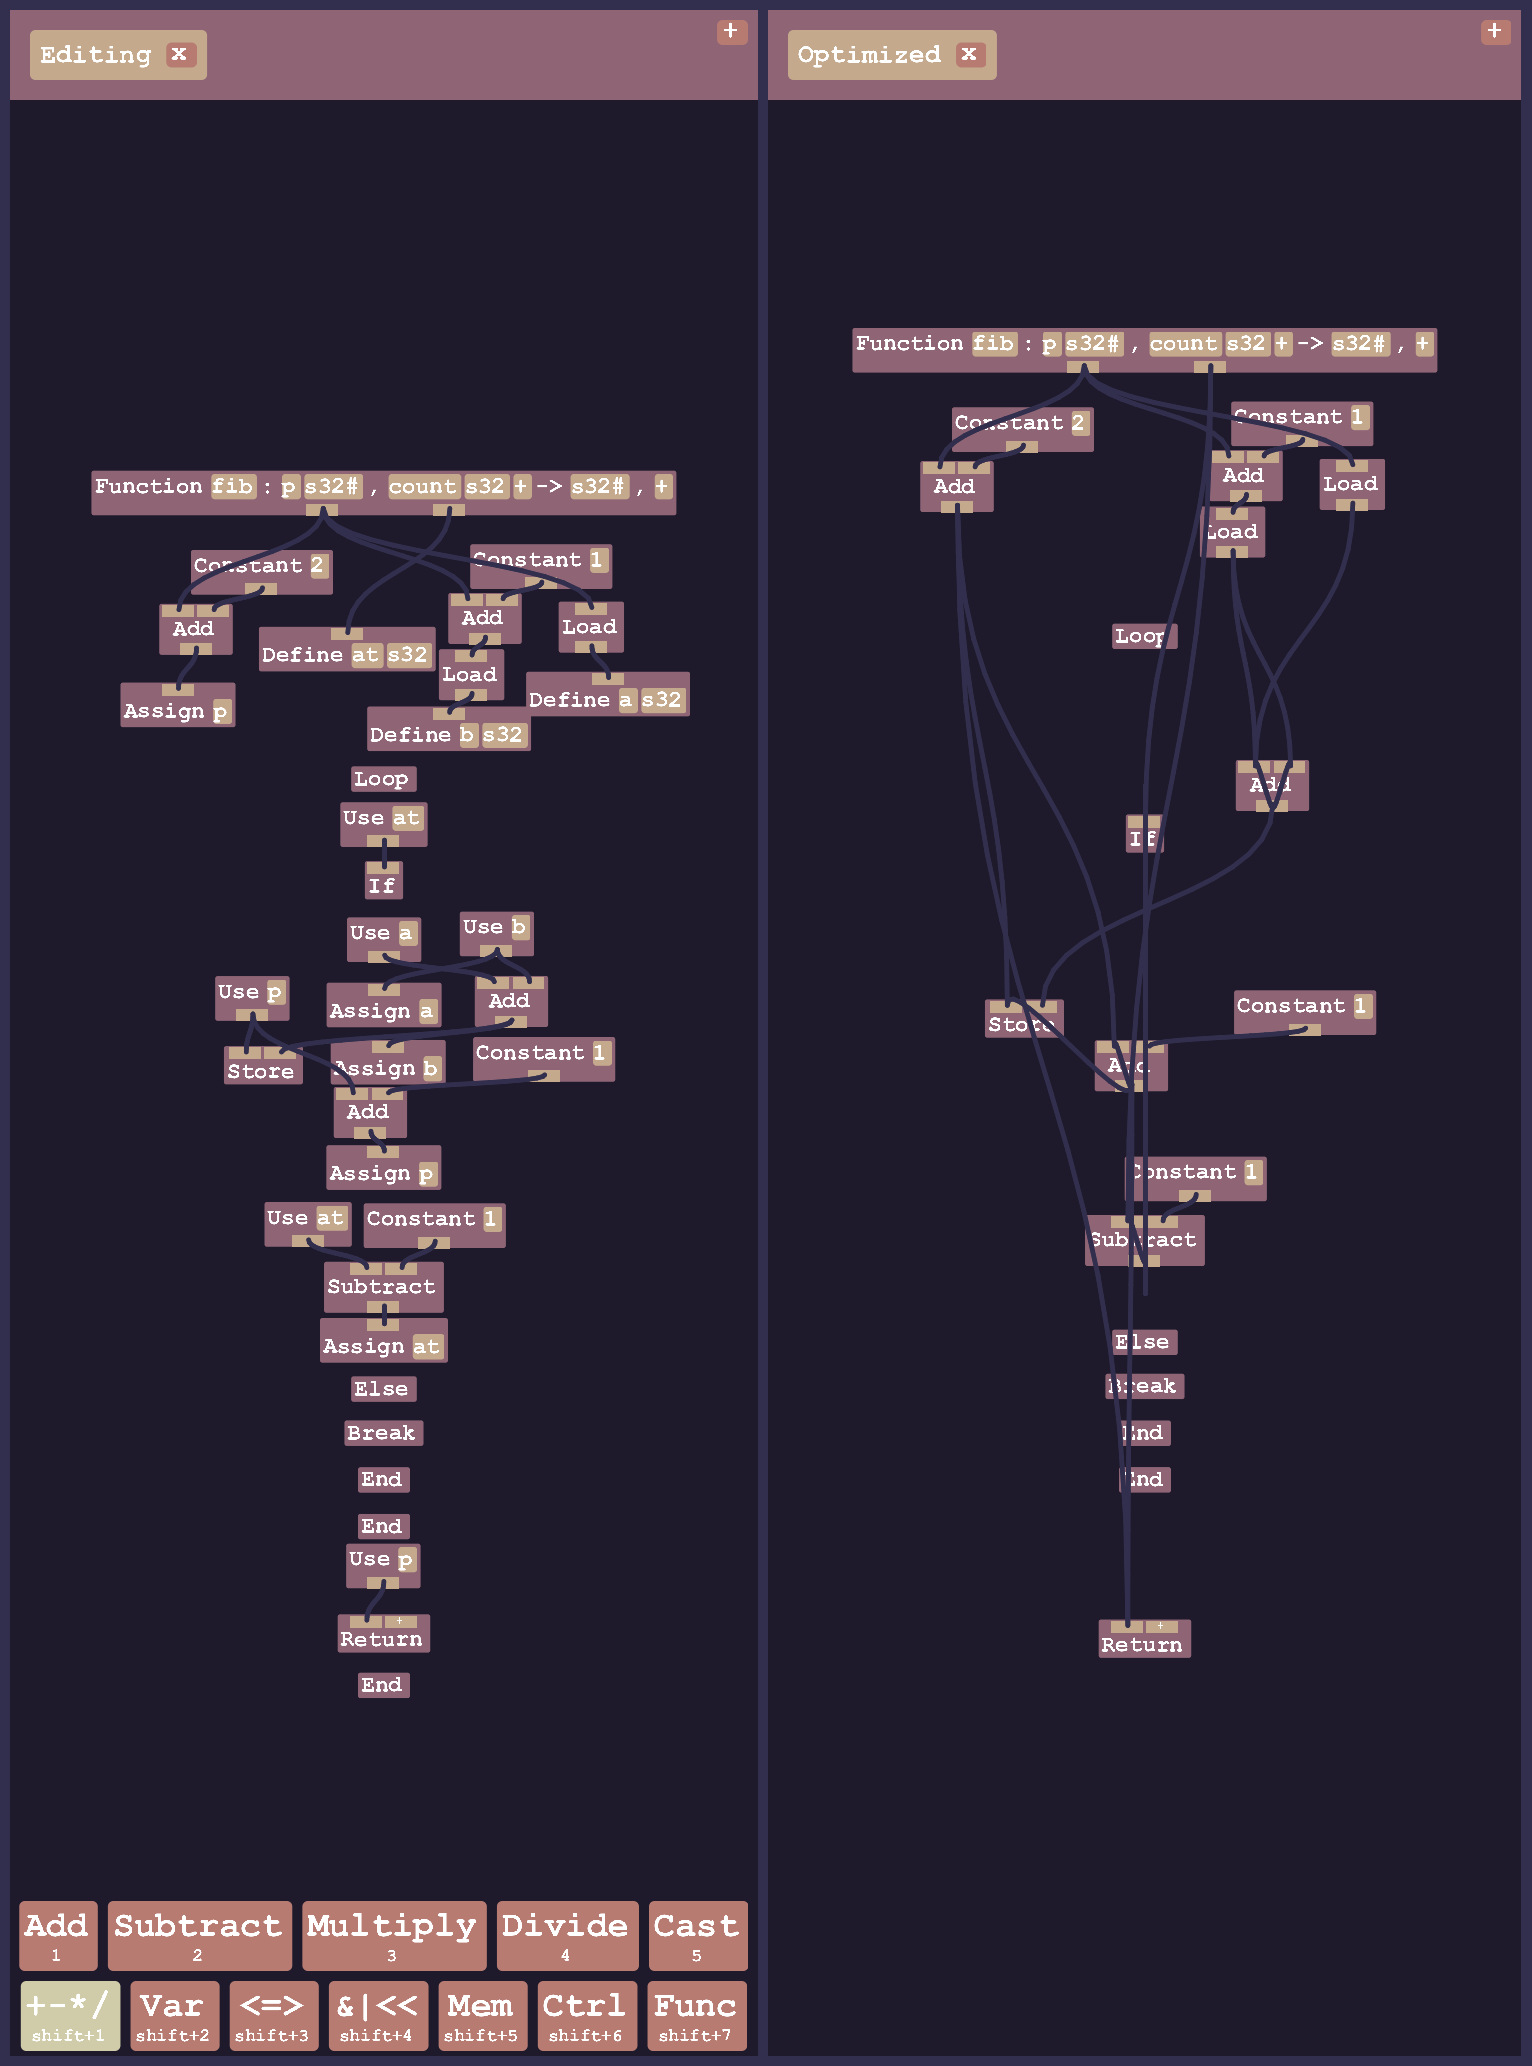
This program has to do with computing Fibonacci numbers. The optimized version removes the idea of variables and just shows the data dependencies directly. As you can see, it is quite messy... I'm working on it, okay?
There are some other cool optimizations that can be visualized, such as constant folding and function inlining.
This project aims to tackle a lot of tricky challenges such as making a decent node editor, and program optimization. There is a lot of work to be done, but I hope this project is unique enough to peak some interest, I haven't seen anything quite like it before.