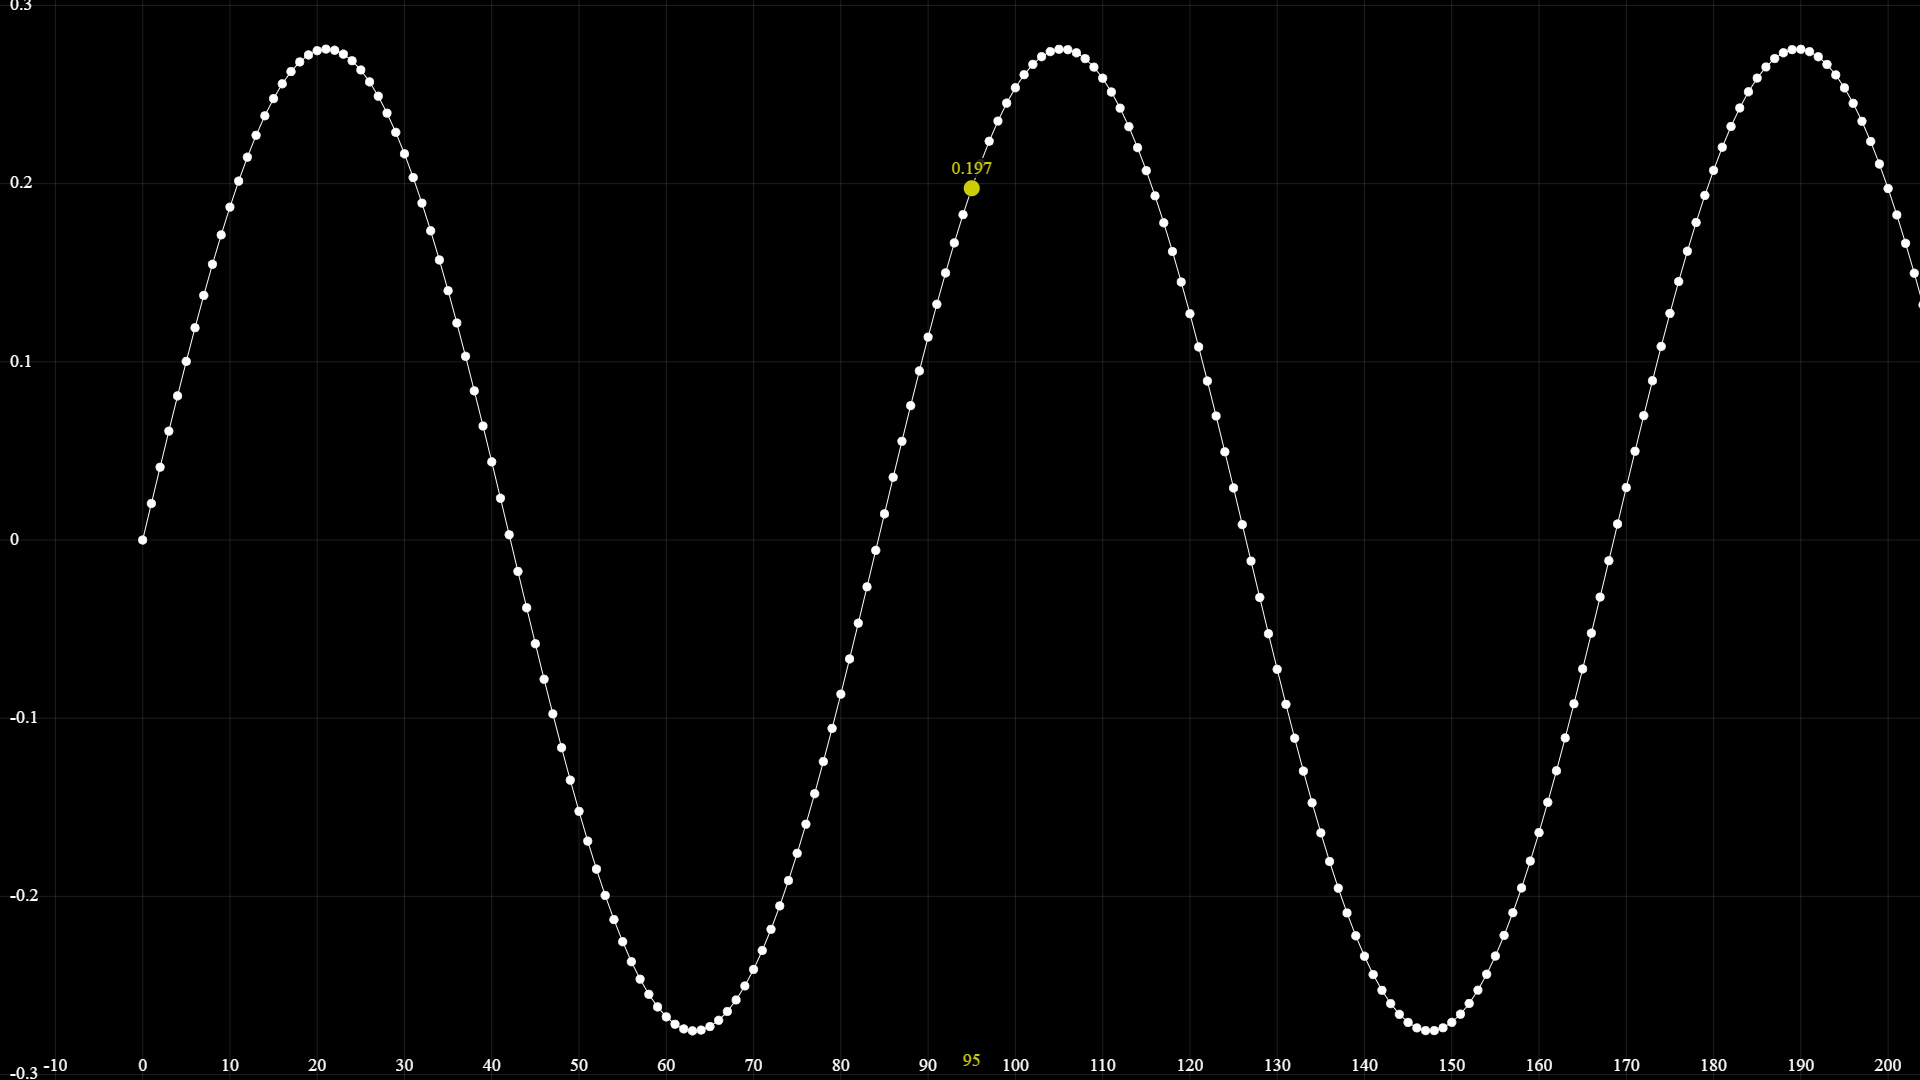
BEdit on-going update; just got the plot html visualization looking at least not bad. This one is generated from a wav file containing a sine wave (note C5) with the following code snippet:
struct WaveFile
{
    RiffHeader header;
    FormatChunk fmt;

    DataChunk(fmt.blockAlign, fmt.bitsPerSample, fmt.channelCount, fmt.audioFormat) data;

    if (fmt.audioFormat == WaveFormatID.IEEE_FLOAT)
    {
        var plot = create_plot();

        for (var channel = 0; channel < fmt.channelCount; channel += 1)
        {
            for (var i = 0; i < data.chunkSize / fmt.blockAlign; i += 1)
            {
                plot_y(fmt.channelCount * plot + channel, data.samples_ieee[i].e[channel]);
            }
        }
    }
}
Still some way to go but progress!
&bedit