
&zbiggestprocess jokes, last minute addition to show historical max peak mem usage process. We have new winners 🙂

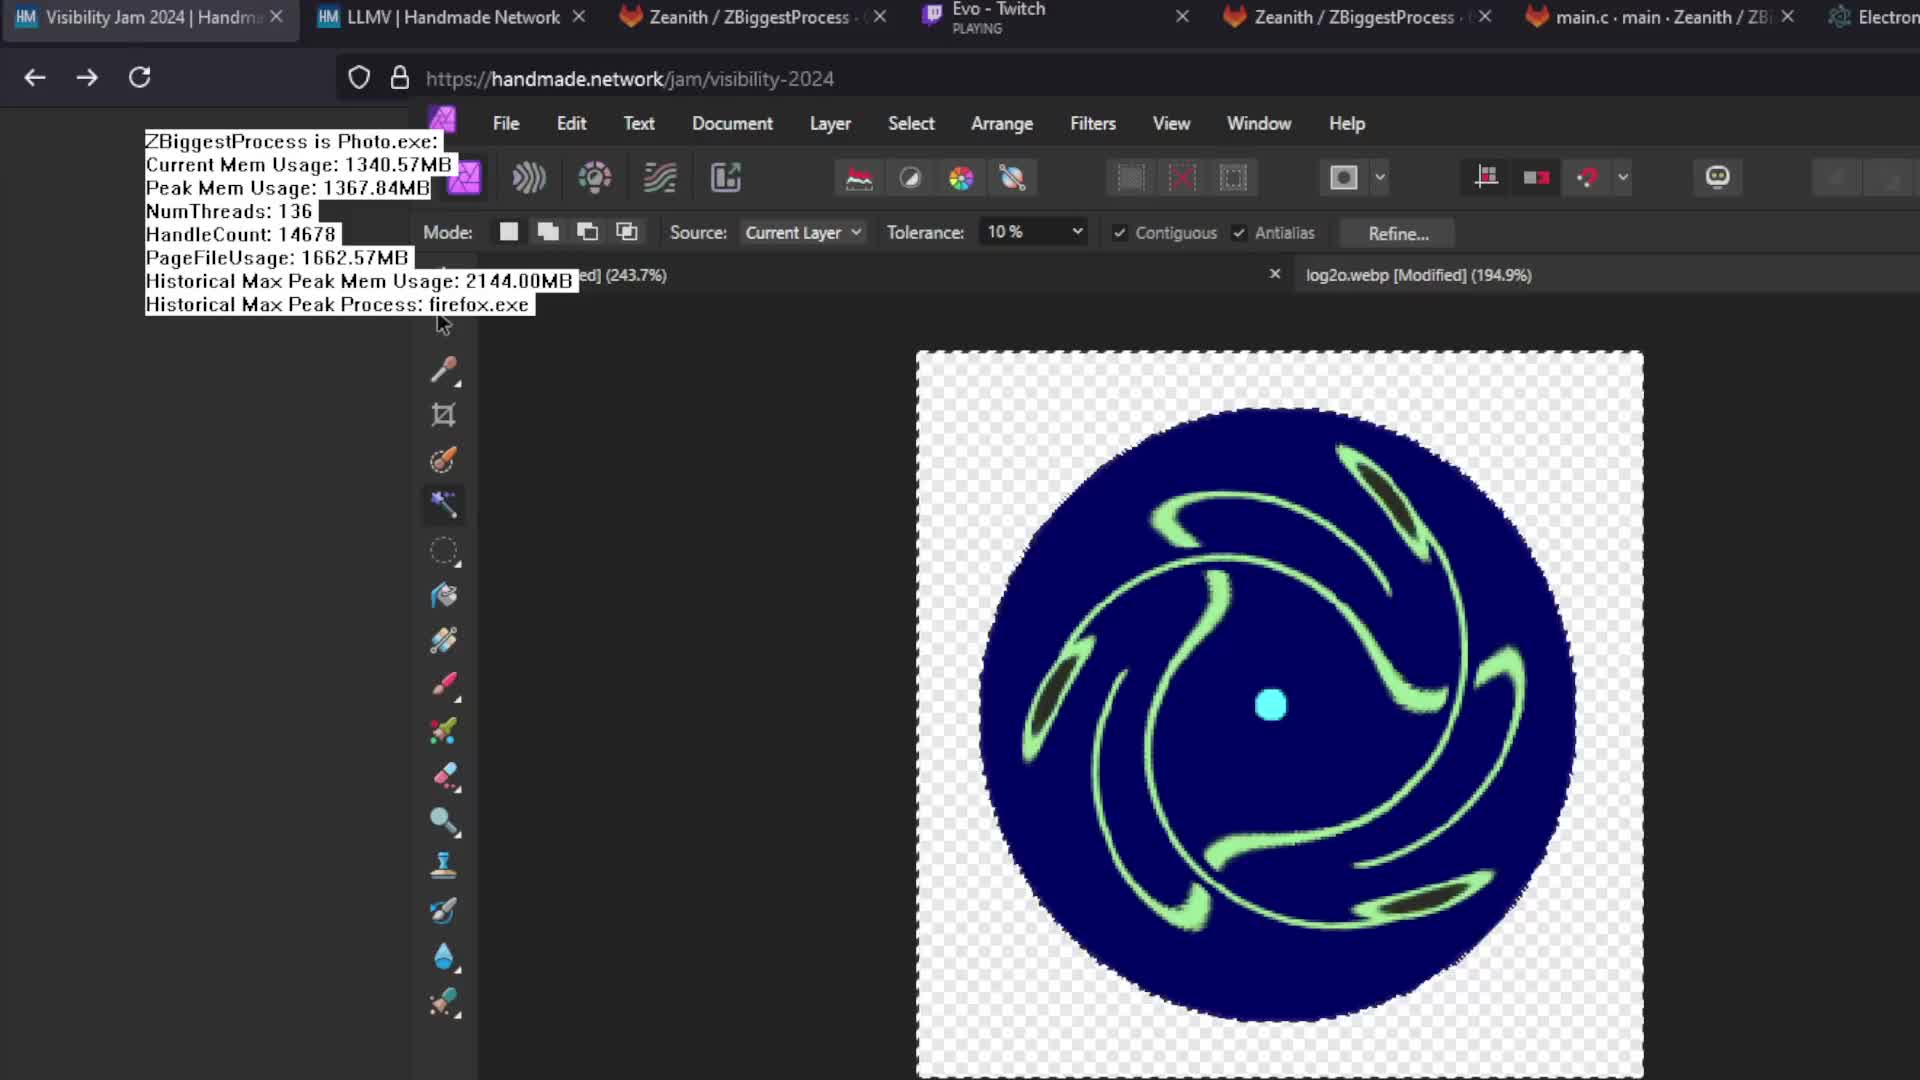
&zbiggestprocess jokes, last minute addition to show historical max peak mem usage process. We have new winners 🙂
Windows exposes a few more metrics in its api than is available to see in Task Manager. ZBiggestProcess shows some of the metrics of the highest memory commited process and displays it as an overlay on screen.
NtQuerySystemInformation with the SystemProcessInformation flag is the heart of this project. The metrics from this method is what the overlay uses to display. Using this method was not as straight forward as I thought, as it returns an array of packed SYSTEM_PROCESS_INFORMATION elements that need to be travered. Each element is packed in memory and can be a different size, so NextEntryOffset needs to be looked at for every element. Once that is all handled getting access to the metrics is very straight forward. All up the project is less than 100 lines of C code.
Memory Compression had the highest peak memory usage at times with a few gigabytes committed.