Handmade Network»Colin

Recent Activity

&spall I ran the same test I did last year for HMS again, to see if Perfetto had caught up, and/or if I'd gotten notably slower.

Nope. Spall is even faster now than it was then, even with all the extra features. (8s -> 6s) That's a good place to be.

Line info is shipped, and I'm puttering away on some UI overhaul stuff to get sampling ready to go. I'm hoping to have basic sampling on one of my target platforms (probably OSX) usable by HMS.

&spall Got line info for PDB auto-tracing working!
I need a round of cleanup, and then I should be able to ship line info for linux and osx (my DWARF stuff is running well), and windows auto-tracing.

It's a big step towards getting good info out of sampling, too.

I got line info working for a fair number of my auto-traced functions in Spall today!
It's not going to be wonky/misaligned forever, I'm just testing / verifying that I'm doing my DWARF parsing correctly right now.

&spall Little update to Spall today, got double-click to zoom working after a little debugging with @negate32!

It's a nice little feature that I've been meaning to do for ages, makes it much easier to see children under a parent function

&paperplate After a ton of digging, I couldn't find a CI system I liked.
Working on a better one that I can integrate with Gitea.

Finally got my rough sketch into the browser, now to flesh out the go-server API so I can build pipelines and save properly, and get the runners fetching tasks/reporting back.

&spall It was a rough few days (and I'm sure I'll see a looming bug-report or two in the next few days), but I've finally got some of my big paid-version changes from Spall-native, backported to the web version!

Spall-web, now with histograms, a smaller LOD tree, a better selection interface, and a redesigned timescale.

&spall My new batch of memory came in today, so now I can do serious load-testing.
I still have plenty more footprint to crunch down, but I'm now able to load 2.3 billion functions from Python, and dig through them at reasonable framerates

&spall It's a little silly, but I've been poking at load-times and memory usage again, and I figured it'd be interesting to see how that reflected on my older traces.

This is the JSON trace that took about ~8s to load at HMS on the web, now loading in ~3.2, from boot to usable on the native version.

(The binary version of this trace takes ~350ms)

&spall So, I decided to go spelunking in gdb today. Learned many things.
Auto-tracing gdb is a pain in the ass, because gdb's thread pool starts before main. Very C++, such wow.
(this trace video doesn't have the ~10+ other threads GDB spun up before main started, more research needed to inject spall earlier)

When GDB does symbol resolution, it runs resolvers for a pile of languages, one after another, for each symbol.

Launching Spall-native in beta today!
https://gravitymoth.itch.io/spall

If you're not familiar with Spall, it's a profiler with a zippy frontend.
There's a free/open-source web-version to play with over at https://gravitymoth.com/spall/spall-web.html

The web version has C/C++ support, integration with Odin via core:prof/spall, and chrome://tracing JSON file compatibility.

The native version has all that, and it can handle much bigger files, loads faster, has function latency histograms, runs on Windows, OSX, and Linux, can launch from the command line, and supports a new auto-tracing format which is faster/more compact, for doing LARGE traces, like the one I took of Python a week or two ago.

&spall it's silly, but I hit a new record tonight that excited me. I've used literally all of my memory and gone swapping (~32 GB), but I've got 500M functions from a complete auto-trace of python running build-tests, rendering at 60-80 fps. (actively crunching stats dips the framerate a little)

I need to do more work to chop memory usage down, but it's getting there.

&spall Needs more visual polish and a few UX issues ironed out, but I'm making headway on a process/thread filter for stat-crunching.

&spall Doing a little more tinkering today. This was an important one on my plate.
Stat-pane resizing!

This is a lead-in for better thread-selection stuff, in the new bottom tab-bar

&tosk It's not totally working yet, but I'm making progress. Fighting with OSX struct layout porting to Odin has been an absolute nightmare, but I'm getting there.

@NeGate and I have made a little more progress on our little research microkernel!

Got multi-core mostly working, the TSC frequency sorted from the HPET, and we're almost ready to start scheduling and building out drivers.
Maybe a day or two out from being able to tinker with our pile of ideas for scheduling, process management, and core-scaling.

&spall Messed with auto-tracing LuaJIT this evening, getting back into Spall after a bit of a hiatus.

local samples = 1000000
local T = {}
local CachedTable = {"abc", "def", "ghk"}

local function test1(times)
    T[times] = CachedTable
end

do
    for warm = 1, samples do
        test1(warm)
    end
end

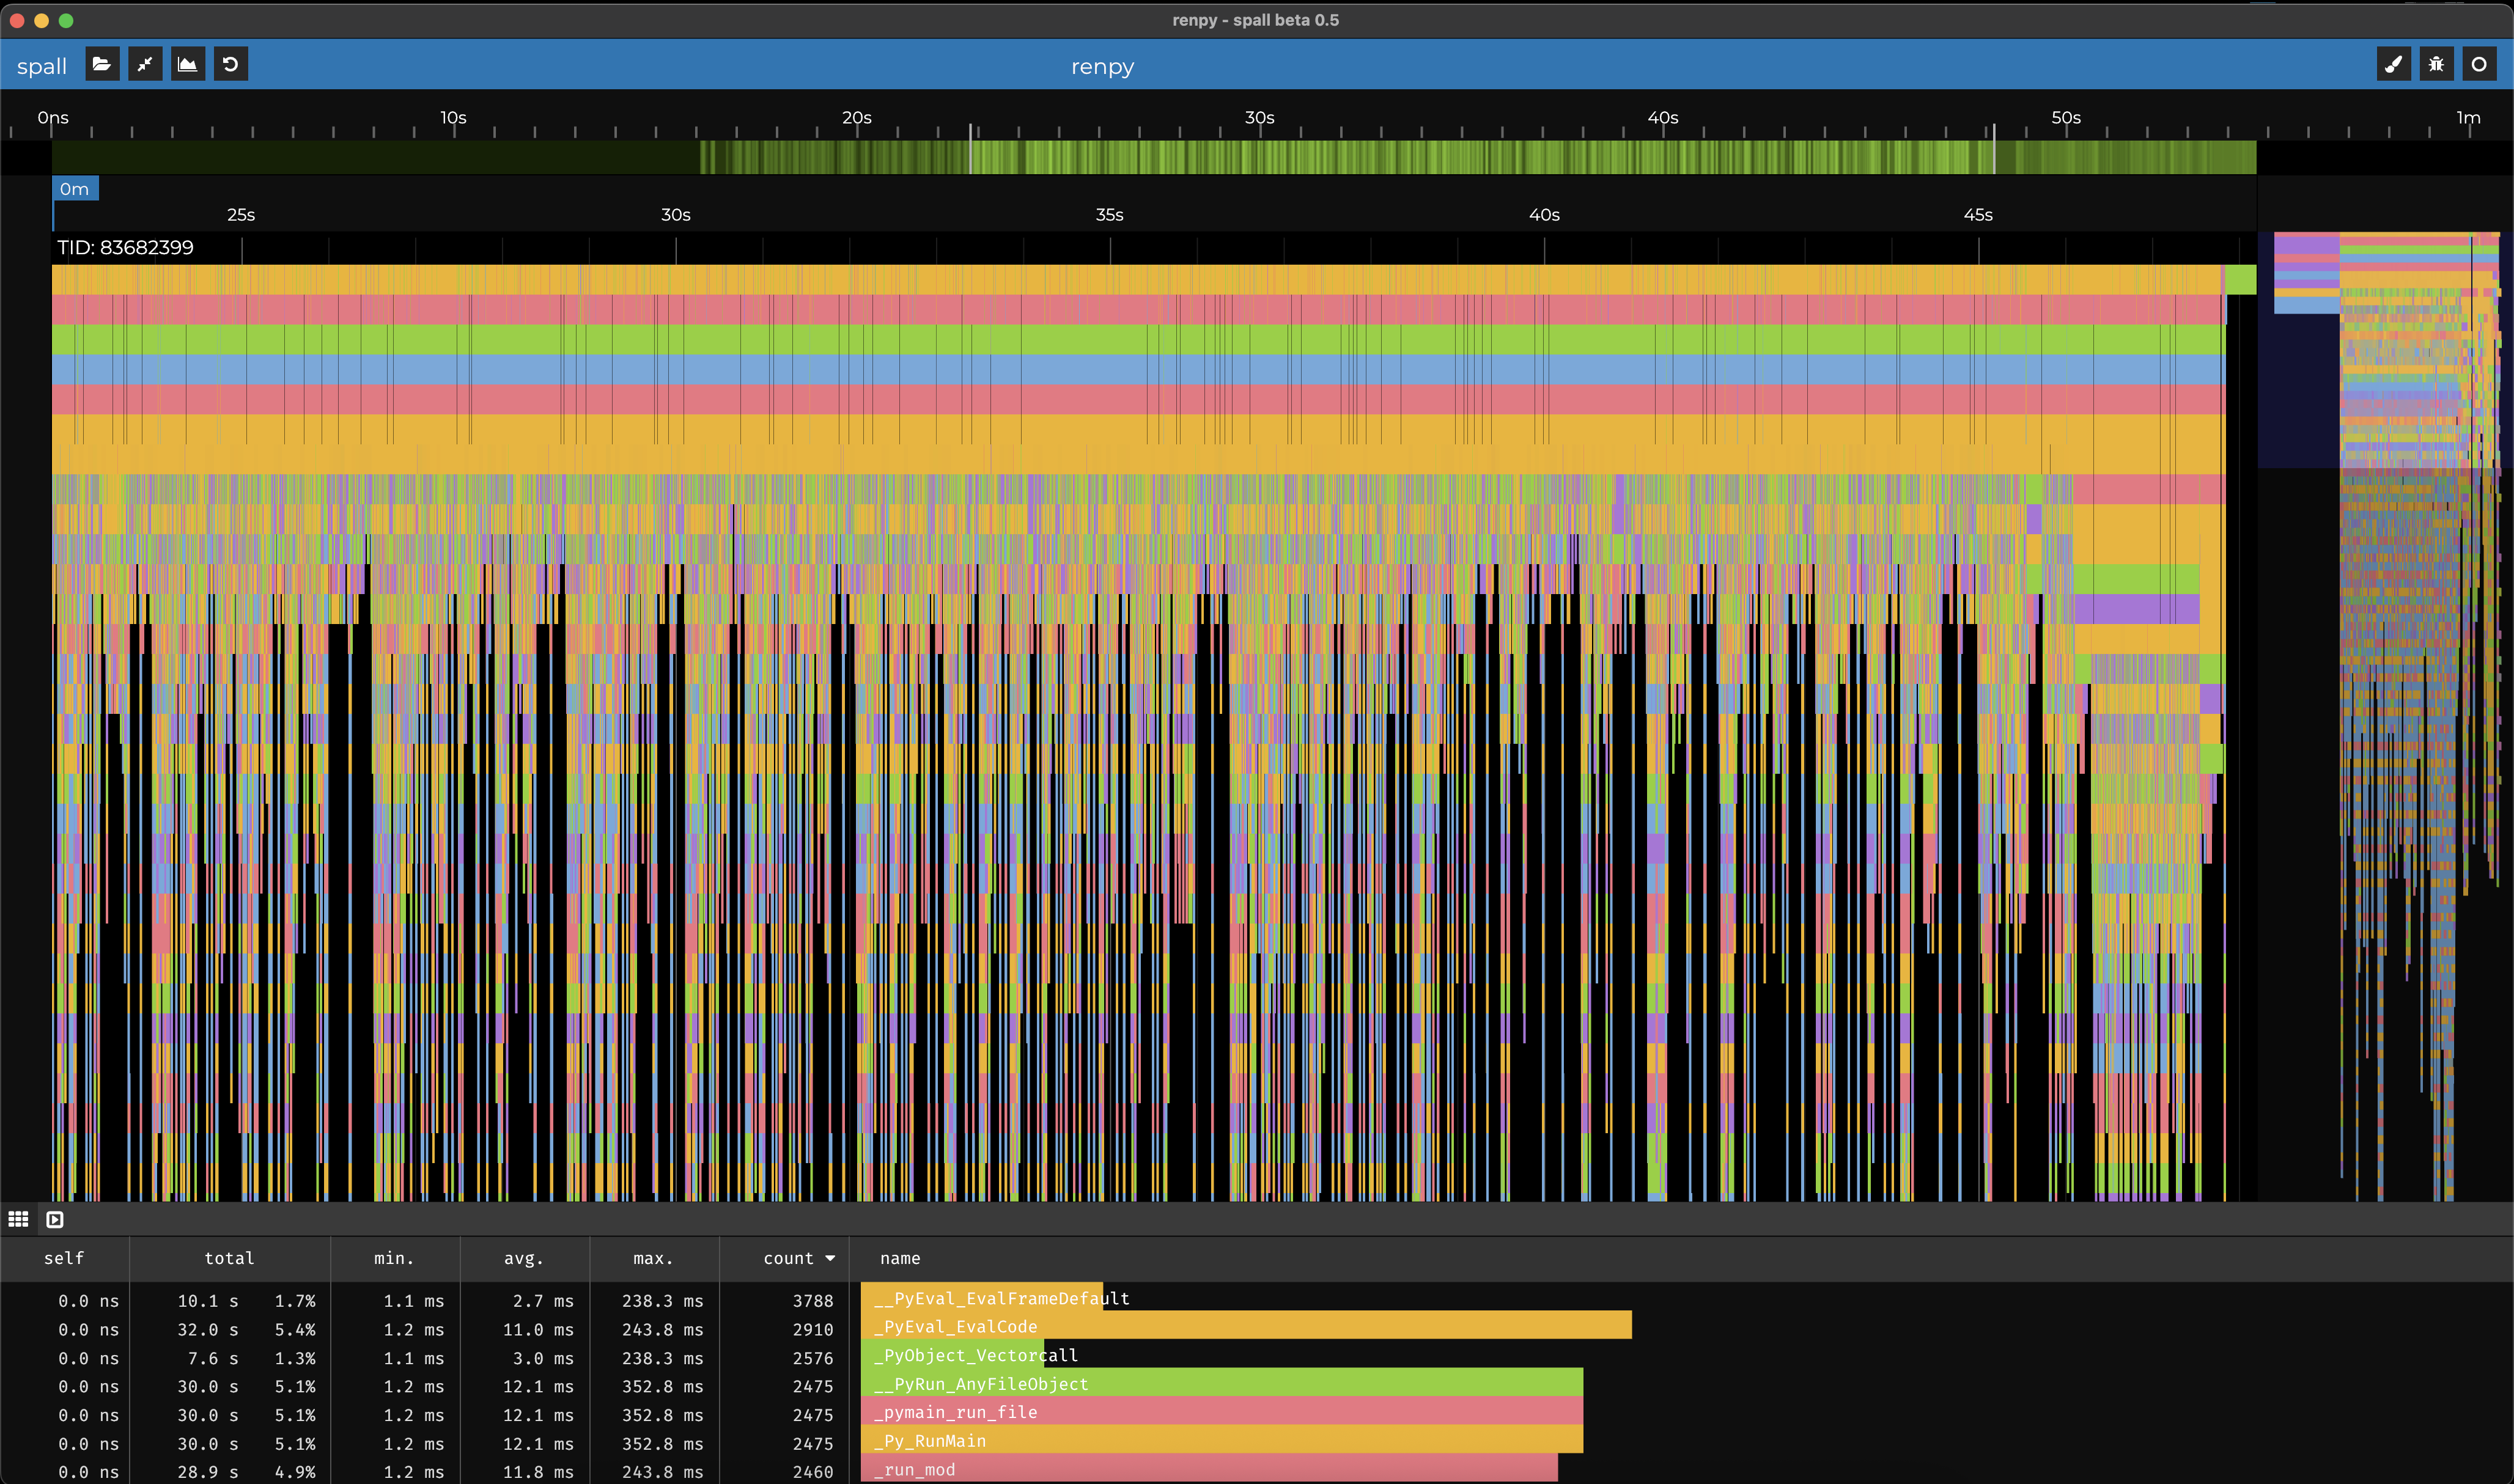
Interesting to note, for simple bench tests, the more loop iterations you have, the longer the JIT seems to take to kick in.

for 100,000 iterations it takes >1ms to move to JITted code
for 1,000,000, it's 8ms
and for 10,000,000 it's ~60ms

The actual asm-gen part of LuaJIT is incredibly zippy. ~50-100us here
(the spiky part)

Playing a little with data-viz to recharge / clear my head.

This is a bitmap-dumper overlay for memory, to help debug page tables, interrupts, etc. on a little hobby kernel project @NeGate and I have been tinkering with for a while now.

colored "pixels" (scaled way up) are page-table entries with things in them, so I can get a sense for how sparse the data is.

&spall It doesn't look like much, but this was a lot of learning-pain :P
Got the file open dialog working on OSX, which involved fussing with objc_msgsend and learning how to translate apple-docs to C-ish code in my head.

Big thanks to @Perlind for all the help getting this working!

&spall microevents using the new pdb resolver for Windows confirmed working today, thanks to @NeGate.
Cuik self-tracing, compiling sqlite3, with a ~166MB trace (down from ~280MB, I think). \o/

Negate has small function names, so things didn't shrink that much. :P

&spall So, uh, new milestone!
I'm tracing python running self-tests, getting 400 million functions, rendered at 60fps.
(that's 40 million functions per second average, captured)

It eats all of my memory, but it's huge progress.

cpython is somewhere around ~500kloc of C, according to tokei (take that with a major grain of salt, I'm sure)

&spall Got microevents working and resolving symbols on OSX. Still needs C++ name demangling, but the essence is there.

The Odin compiler on this machine spends 500ms+ (aggregating across threads) while compiling spall, calling memcpy. wild

&spall Threaded-writing for auto-tracing is in!

This is a seamless (no big disk-write gaps) trace of Odin compiling spall. All 120 million function calls at 60 fps on a meh intel mac laptop.

Now for the hard part, offline symbol resolution :P

This is Odin compiling spall, automatically traced, using microevents.

With 120M events, this was ~7.2 GB of data on disk before the change, and now it's 2.8 GB, with half the program overhead it used to have.

The thin column-gaps are disk-stalls, I still need to make writes non-blocking to fully eliminate them. I also need to write an address-to-name post-run resolver for each platform that the auto-tracer supports.

I'm almost LLVM-trace-ready. It's going to happen, and it's going to be amazing.

Ooh, also, I got my threadpool mostly-shippable today!
https://github.com/colrdavidson/workpool

it's a single-header C library, should be reasonable to pull in. It works on Windows, OSX, Linux, FreeBSD, and OpenBSD, and clang/gcc/msvc.
probably has some C++ interop issues, haven't tested that extensively yet.

Working on a work-stealing threadpool to help Odin scale better at high core-counts. Thread spin-up and teardown aside, things are looking great!

Code is definitely janky at the moment as I'm cross-platform'ing, I need to retest on Linux after today's changes, and I need to add support for OSX's futexes, but I'm mostly pleased with my current numbers.
https://github.com/colrdavidson/workpool

&spall Writing a workstealing threadpool to even out a multi-producer,multi-consumer job DAG. Realized today I wrote a thing to make my life easier. Immediately spotted the mutex contention issue after plopping it in.

I should have written this thing ages ago. Thank you @bvisness
It's finally at a point where it's useful to me. <3

&spall Hashed out a lovely new feature for spall-native this evening with @philliptrudeau!
Histograms for functions! Lots still to do to make them shippable, but they're useful for us, even without the polish.

very handy for self-profiling the profiler's event emitter, and for figuring out WTF "average" for a function with huge tail latencies looks like.
There are also some big library changes on the way soon to get profile traces even faster and make library-building with spall much easier, hopefully those should be ready and in master in the next day or two.

&spall native can now launch with a trace-file passed as a command line argument.

I've been a little busy lately with demo-prep, but this one's for @NeGate's booth. Had to happen. :P

Ok, text isn't quite right yet, I don't have a loading screen, and selection doesn't quite work, but it's almost usable now.

It's hard to tell which one I'm using at this point, horribly broken multiselect animations aside. :P

still needs text rendering and a lot of platform normalization, but spall-native is coming along pretty quickly.

It's a small thing, but it helps a ton for big files.
Just pushed a change that builds self-times during parsing for binary files. Should cut a few seconds off spall load times, and also clean up a few weird edge-cases for begin events with no end.

Some good suggestions from @Phil H later, and a bunch of site work done, and spall is now live!

You can now vertically scroll with your scroll wheel by hovering over the mini-tree on the side, and there's a global scale to help you figure at where you're at in your trace.

https://gravitymoth.com/spall?refresh_unfurl=plz

it's a small change, but it makes a big difference.
Thanks to @bvisness for the suggestion!

So, more little things today..
Spall can now show thread/process names from chrome's tracing format, scroll stats, pan while you've got things selected, and read/display the juicy bits of chrome's sampling profiler data.

If you're sick of waiting for the chrome performance tab's profiler to zoom at 0 fps, trying to see what's taking so long in your JS code, you can now load them into spall.

Thanks to @bvisness for doing some serious groundwork figuring out the format.

My sampling profile import is a little beta because it's an undocumented format, so results may definitely vary.

Did some work this evening making JSON parsing a bit faster.
Doing around 500 MB in ~6 seconds now. (around 2x faster than it was)

I think we're ready to demo.

Starting to dig a little more of the ol' netsim code out while doing some visual polish today. Can't just be a boring old profiler, it's gotta feel good.

Ok, probably the last big feature before proper ship is in. We now have the ability to print self-time per function!

Also, because you probably want it, there's a lovely new button at the top left to crunch stats for your whole file.

Hopefully everything left now is cleanup, polish, and optimization.

a little under 1 GB of binary trace data taken from a 30 minute happenlance burn-test, loaded in 6 seconds.
You can now do stats without tanking the framerate too, which is nice.

Getting close to a proper launch. Needs another bug pass, but I'm hoping to get it up in beta in the next week or two

More usability features!
Added the top bar, so you can tell where you are on the x-axis while zoomed in, and you get a quick view of thread activity so you can spot program slow-points.

Not 100% sold on my current colors for the periphery views yet though.

So, I don't recommend this at all because the iPad WASM jit doesn't like to free memory when you refresh, but it does work for ~500 MB json files, mostly.

Working on rendering speed today. Still some lurking z-index issues, but we can now load and smoothly zoom/pan through 6 million events (300 MB of spall-binary, or ~700 MB of JSON) at 165 fps.

This is cuik processing a massive generated fibonacci program.

So, I felt like doing a little upgrade to my speed test. This is 540 MB, emitted from chrome's self-profiler. (the last one was 40 MB)
There's definitely some UI/UX polish left to do on my end (it's hard to squish so many profilers on the screen, so things are a little scrunched :P), I need to properly name PIDs and TIDs like perfetto/speedscope can, and I'm working with our resident JSON wizard, @demetrispanos to speed things up even more, but the numbers speak for themselves.

(chrome://tracing failed to load the file entirely)

One more big batch of changes, and it's finally feature-complete enough to feel real.
Needs polish for days and a big cleanup / optimization pass, but multiselect and stats are in.
Time for a nice long Zzz.

This time, we're featuring a lovely trace from Happenlance, killing it with incredible frametimes. Hopefully we'll get similar frametimes too after some tweaking.

After a long all-nighter with Philip and Jeroen, LOD is in!
This is a 530 MB JSON dump from chrome's chrome://tracing self-record feature that chrome://tracing's renderer fails to open, and takes a solid, laggy year to load and zoom around in perfetto.

After a bunch of optimization and TLC, we're at ~530 MB json trace files in ~8 seconds, plus with some collab with @philliptrudeau, I've also added support for a binary ingest format that loads around 10x faster than that.
Still needs some LOD love, but it's coming soon, I swear. :P @bvisness hopefully, I'll be at a point where your 1 GB trace files are totally viable, soon. More UI/UX work to go, but load times are now in the ballpark of tolerable, especially if you don't need JSON specifically.

With some huge help from our resident superhero, @philliptrudeau, we've got support for smooth scrolling, panning, and pan-to-zoom now!
Up next on my list is handling begin and end events, so I can process more config files, and improving my 1GB+ trace frametimes, but the core is now solid.

Got my Odin/WASM flamegraph tracer build/running well. Works on tablets, and (at least with my current ~900 KB of test data) boots faster than perfetto or chrome://tracing. Almost good enough to replace chome://tracing for small files, just needs slightly better zoom + time window selection.

https://github.com/colrdavidson/tracey

Had to tweak &netsim just a little, because it was annoying me.
Added support for touchscreens, pinch-to-zoom on the graph, and tabbed out the menu bits so it'll fit properly on a horizontal iPad.

Final jam ship for &netsim
It's live over at https://bvisness.me/apps/netsim/ and it's incredibly jank. Enjoy!

We've got some fancy new buttons, congestion control, an IP routing rule builder, and some configurables for ACK delay and congestion control.
The best procedural musical instrument you didn't know you wanted.

Today was mostly polish. Lots of fiddly background stuff, like hooking up session storage so it'll save the fact that you muted it across refreshes, a little bit of input handling (space is now start/stop), and some mild visual tweaks to make logs more legible. &netsim

Some fun new bits/pieces today! We've got TCP logging, simulation controls, and some slightly tweaked colors. &netsim

Network-sim-as-an-instrument, now with more graphs! &netsim

After some hard work by @bvisness, we've got some fancy animations for packet routing / buffers! &netsim